Yaqui vs Pennsylvania German Unemployment Among Ages 35 to 44 years
COMPARE
Yaqui
Pennsylvania German
Unemployment Among Ages 35 to 44 years
Unemployment Among Ages 35 to 44 years Comparison
Yaqui
Pennsylvania Germans
5.3%
UNEMPLOYMENT AMONG AGES 35 TO 44 YEARS
0.1/ 100
METRIC RATING
265th/ 347
METRIC RANK
4.7%
UNEMPLOYMENT AMONG AGES 35 TO 44 YEARS
53.0/ 100
METRIC RATING
169th/ 347
METRIC RANK
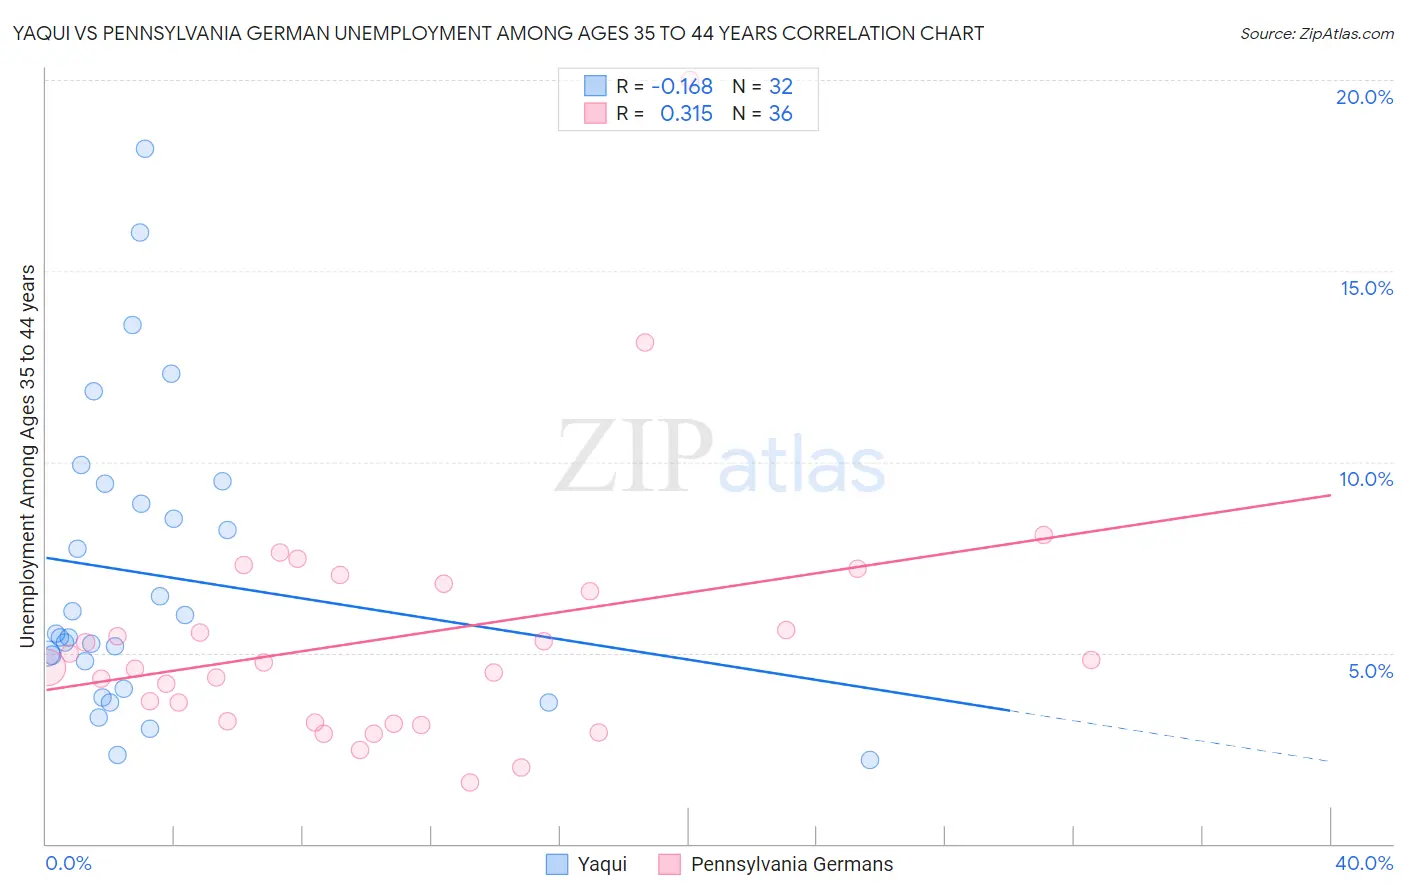
Yaqui vs Pennsylvania German Unemployment Among Ages 35 to 44 years Correlation Chart
The statistical analysis conducted on geographies consisting of 107,134,847 people shows a poor negative correlation between the proportion of Yaqui and unemployment rate among population between the ages 35 and 44 in the United States with a correlation coefficient (R) of -0.168 and weighted average of 5.3%. Similarly, the statistical analysis conducted on geographies consisting of 227,862,301 people shows a mild positive correlation between the proportion of Pennsylvania Germans and unemployment rate among population between the ages 35 and 44 in the United States with a correlation coefficient (R) of 0.315 and weighted average of 4.7%, a difference of 13.6%.
Unemployment Among Ages 35 to 44 years Correlation Summary
| Measurement | Yaqui | Pennsylvania German |
| Minimum | 2.2% | 1.6% |
| Maximum | 18.2% | 20.0% |
| Range | 16.0% | 18.4% |
| Mean | 7.0% | 5.4% |
| Median | 5.4% | 4.7% |
| Interquartile 25% (IQ1) | 4.4% | 3.2% |
| Interquartile 75% (IQ3) | 9.2% | 6.7% |
| Interquartile Range (IQR) | 4.7% | 3.5% |
| Standard Deviation (Sample) | 3.9% | 3.3% |
| Standard Deviation (Population) | 3.9% | 3.3% |
Similar Demographics by Unemployment Among Ages 35 to 44 years
Demographics Similar to Yaqui by Unemployment Among Ages 35 to 44 years
In terms of unemployment among ages 35 to 44 years, the demographic groups most similar to Yaqui are Immigrants from Bangladesh (5.3%, a difference of 0.020%), Immigrants from Western Africa (5.3%, a difference of 0.14%), Ghanaian (5.3%, a difference of 0.19%), Choctaw (5.3%, a difference of 0.20%), and Hawaiian (5.3%, a difference of 0.22%).
| Demographics | Rating | Rank | Unemployment Among Ages 35 to 44 years |
| Immigrants | Latin America | 0.1 /100 | #258 | Tragic 5.3% |
| Mexicans | 0.1 /100 | #259 | Tragic 5.3% |
| Sub-Saharan Africans | 0.1 /100 | #260 | Tragic 5.3% |
| Spanish Americans | 0.1 /100 | #261 | Tragic 5.3% |
| Immigrants | Central America | 0.1 /100 | #262 | Tragic 5.3% |
| Choctaw | 0.1 /100 | #263 | Tragic 5.3% |
| Ghanaians | 0.1 /100 | #264 | Tragic 5.3% |
| Yaqui | 0.1 /100 | #265 | Tragic 5.3% |
| Immigrants | Bangladesh | 0.1 /100 | #266 | Tragic 5.3% |
| Immigrants | Western Africa | 0.0 /100 | #267 | Tragic 5.3% |
| Hawaiians | 0.0 /100 | #268 | Tragic 5.3% |
| Cajuns | 0.0 /100 | #269 | Tragic 5.3% |
| Blackfeet | 0.0 /100 | #270 | Tragic 5.3% |
| Ute | 0.0 /100 | #271 | Tragic 5.3% |
| Senegalese | 0.0 /100 | #272 | Tragic 5.3% |
Demographics Similar to Pennsylvania Germans by Unemployment Among Ages 35 to 44 years
In terms of unemployment among ages 35 to 44 years, the demographic groups most similar to Pennsylvania Germans are Arab (4.7%, a difference of 0.010%), Immigrants from Indonesia (4.7%, a difference of 0.030%), Indonesian (4.7%, a difference of 0.090%), Peruvian (4.7%, a difference of 0.10%), and Lebanese (4.7%, a difference of 0.12%).
| Demographics | Rating | Rank | Unemployment Among Ages 35 to 44 years |
| Costa Ricans | 59.6 /100 | #162 | Average 4.7% |
| South Africans | 58.5 /100 | #163 | Average 4.7% |
| Immigrants | Morocco | 57.2 /100 | #164 | Average 4.7% |
| German Russians | 57.2 /100 | #165 | Average 4.7% |
| French | 55.6 /100 | #166 | Average 4.7% |
| Peruvians | 54.4 /100 | #167 | Average 4.7% |
| Arabs | 53.1 /100 | #168 | Average 4.7% |
| Pennsylvania Germans | 53.0 /100 | #169 | Average 4.7% |
| Immigrants | Indonesia | 52.6 /100 | #170 | Average 4.7% |
| Indonesians | 51.7 /100 | #171 | Average 4.7% |
| Lebanese | 51.4 /100 | #172 | Average 4.7% |
| Iraqis | 50.9 /100 | #173 | Average 4.7% |
| Afghans | 50.0 /100 | #174 | Average 4.7% |
| Immigrants | Germany | 48.9 /100 | #175 | Average 4.7% |
| Immigrants | Uganda | 48.1 /100 | #176 | Average 4.7% |