Yaqui vs Immigrants from Argentina Householder Income Under 25 years
COMPARE
Yaqui
Immigrants from Argentina
Householder Income Under 25 years
Householder Income Under 25 years Comparison
Yaqui
Immigrants from Argentina
$48,300
HOUSEHOLDER INCOME UNDER 25 YEARS
0.0/ 100
METRIC RATING
298th/ 347
METRIC RANK
$54,209
HOUSEHOLDER INCOME UNDER 25 YEARS
99.3/ 100
METRIC RATING
93rd/ 347
METRIC RANK
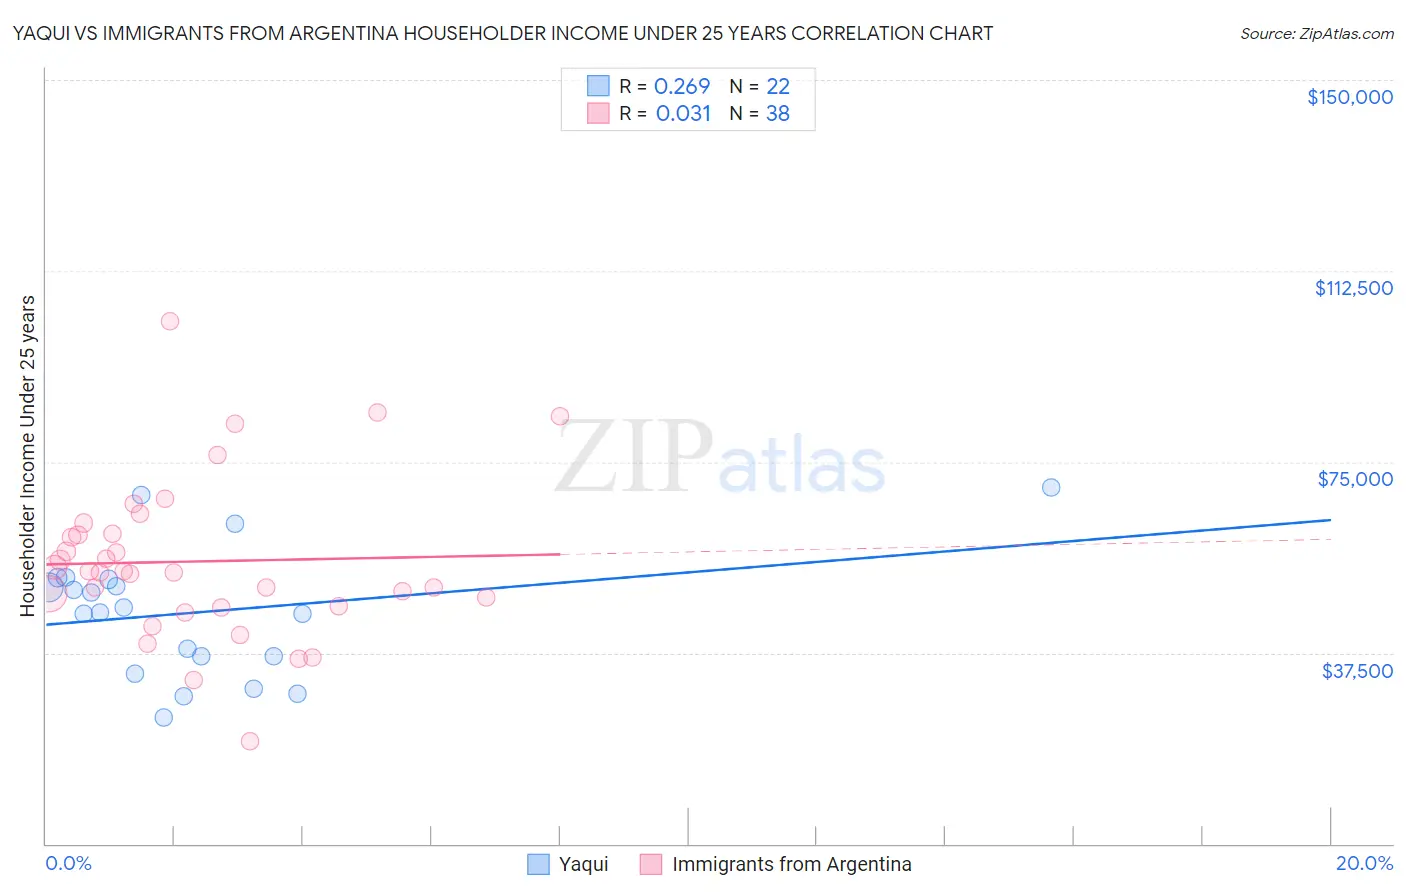
Yaqui vs Immigrants from Argentina Householder Income Under 25 years Correlation Chart
The statistical analysis conducted on geographies consisting of 100,142,881 people shows a weak positive correlation between the proportion of Yaqui and household income with householder under the age of 25 in the United States with a correlation coefficient (R) of 0.269 and weighted average of $48,300. Similarly, the statistical analysis conducted on geographies consisting of 229,141,308 people shows no correlation between the proportion of Immigrants from Argentina and household income with householder under the age of 25 in the United States with a correlation coefficient (R) of 0.031 and weighted average of $54,209, a difference of 12.2%.
Householder Income Under 25 years Correlation Summary
| Measurement | Yaqui | Immigrants from Argentina |
| Minimum | $24,739 | $20,094 |
| Maximum | $70,037 | $102,571 |
| Range | $45,298 | $82,477 |
| Mean | $45,409 | $55,432 |
| Median | $45,880 | $53,374 |
| Interquartile 25% (IQ1) | $36,750 | $46,727 |
| Interquartile 75% (IQ3) | $51,924 | $60,828 |
| Interquartile Range (IQR) | $15,174 | $14,101 |
| Standard Deviation (Sample) | $12,300 | $15,762 |
| Standard Deviation (Population) | $12,017 | $15,553 |
Similar Demographics by Householder Income Under 25 years
Demographics Similar to Yaqui by Householder Income Under 25 years
In terms of householder income under 25 years, the demographic groups most similar to Yaqui are Immigrants from Honduras ($48,267, a difference of 0.070%), Immigrants from Somalia ($48,135, a difference of 0.34%), Immigrants from Kuwait ($48,126, a difference of 0.36%), Cree ($48,514, a difference of 0.44%), and Blackfeet ($48,603, a difference of 0.63%).
| Demographics | Rating | Rank | Householder Income Under 25 years |
| Immigrants | Burma/Myanmar | 0.0 /100 | #291 | Tragic $48,749 |
| Shoshone | 0.0 /100 | #292 | Tragic $48,720 |
| Sub-Saharan Africans | 0.0 /100 | #293 | Tragic $48,691 |
| Somalis | 0.0 /100 | #294 | Tragic $48,657 |
| Central American Indians | 0.0 /100 | #295 | Tragic $48,643 |
| Blackfeet | 0.0 /100 | #296 | Tragic $48,603 |
| Cree | 0.0 /100 | #297 | Tragic $48,514 |
| Yaqui | 0.0 /100 | #298 | Tragic $48,300 |
| Immigrants | Honduras | 0.0 /100 | #299 | Tragic $48,267 |
| Immigrants | Somalia | 0.0 /100 | #300 | Tragic $48,135 |
| Immigrants | Kuwait | 0.0 /100 | #301 | Tragic $48,126 |
| Immigrants | Liberia | 0.0 /100 | #302 | Tragic $47,981 |
| Immigrants | Middle Africa | 0.0 /100 | #303 | Tragic $47,916 |
| Menominee | 0.0 /100 | #304 | Tragic $47,907 |
| Cherokee | 0.0 /100 | #305 | Tragic $47,848 |
Demographics Similar to Immigrants from Argentina by Householder Income Under 25 years
In terms of householder income under 25 years, the demographic groups most similar to Immigrants from Argentina are Immigrants from Sierra Leone ($54,190, a difference of 0.030%), Immigrants from St. Vincent and the Grenadines ($54,230, a difference of 0.040%), Immigrants from Egypt ($54,239, a difference of 0.050%), Immigrants from Malaysia ($54,179, a difference of 0.050%), and Turkish ($54,266, a difference of 0.10%).
| Demographics | Rating | Rank | Householder Income Under 25 years |
| Immigrants | Croatia | 99.5 /100 | #86 | Exceptional $54,343 |
| Brazilians | 99.5 /100 | #87 | Exceptional $54,335 |
| Yakama | 99.5 /100 | #88 | Exceptional $54,321 |
| Immigrants | South America | 99.4 /100 | #89 | Exceptional $54,268 |
| Turks | 99.4 /100 | #90 | Exceptional $54,266 |
| Immigrants | Egypt | 99.3 /100 | #91 | Exceptional $54,239 |
| Immigrants | St. Vincent and the Grenadines | 99.3 /100 | #92 | Exceptional $54,230 |
| Immigrants | Argentina | 99.3 /100 | #93 | Exceptional $54,209 |
| Immigrants | Sierra Leone | 99.3 /100 | #94 | Exceptional $54,190 |
| Immigrants | Malaysia | 99.2 /100 | #95 | Exceptional $54,179 |
| Argentineans | 99.2 /100 | #96 | Exceptional $54,154 |
| Immigrants | Portugal | 99.1 /100 | #97 | Exceptional $54,105 |
| Eastern Europeans | 99.0 /100 | #98 | Exceptional $54,066 |
| Alaska Natives | 98.8 /100 | #99 | Exceptional $54,000 |
| Immigrants | Kazakhstan | 98.8 /100 | #100 | Exceptional $53,990 |