Yakama vs Paiute Unemployment Among Ages 45 to 54 years
COMPARE
Yakama
Paiute
Unemployment Among Ages 45 to 54 years
Unemployment Among Ages 45 to 54 years Comparison
Yakama
Paiute
5.7%
UNEMPLOYMENT AMONG AGES 45 TO 54 YEARS
0.0/ 100
METRIC RATING
321st/ 347
METRIC RANK
7.8%
UNEMPLOYMENT AMONG AGES 45 TO 54 YEARS
0.0/ 100
METRIC RATING
341st/ 347
METRIC RANK
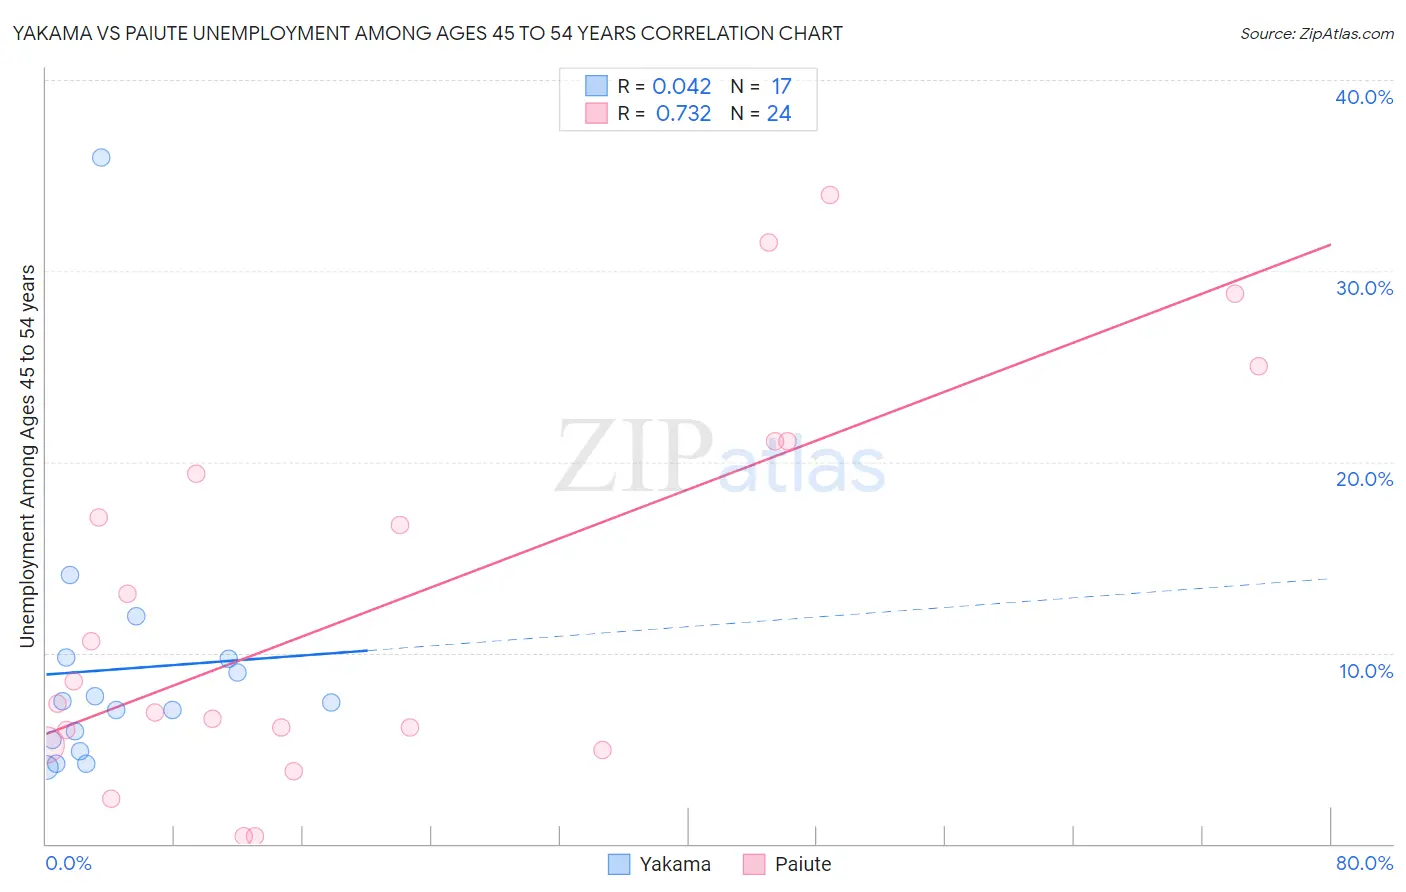
Yakama vs Paiute Unemployment Among Ages 45 to 54 years Correlation Chart
The statistical analysis conducted on geographies consisting of 19,676,341 people shows no correlation between the proportion of Yakama and unemployment rate among population between the ages 45 and 54 in the United States with a correlation coefficient (R) of 0.042 and weighted average of 5.7%. Similarly, the statistical analysis conducted on geographies consisting of 57,983,491 people shows a strong positive correlation between the proportion of Paiute and unemployment rate among population between the ages 45 and 54 in the United States with a correlation coefficient (R) of 0.732 and weighted average of 7.8%, a difference of 36.0%.
Unemployment Among Ages 45 to 54 years Correlation Summary
| Measurement | Yakama | Paiute |
| Minimum | 4.0% | 0.40% |
| Maximum | 36.0% | 34.0% |
| Range | 32.0% | 33.6% |
| Mean | 9.1% | 12.6% |
| Median | 7.4% | 7.9% |
| Interquartile 25% (IQ1) | 5.1% | 5.6% |
| Interquartile 75% (IQ3) | 9.7% | 20.3% |
| Interquartile Range (IQR) | 4.6% | 14.7% |
| Standard Deviation (Sample) | 7.4% | 10.0% |
| Standard Deviation (Population) | 7.2% | 9.8% |
Demographics Similar to Yakama and Paiute by Unemployment Among Ages 45 to 54 years
In terms of unemployment among ages 45 to 54 years, the demographic groups most similar to Yakama are Immigrants from the Azores (5.7%, a difference of 0.51%), Immigrants from Cabo Verde (5.9%, a difference of 3.5%), Native/Alaskan (6.1%, a difference of 5.9%), Immigrants from Armenia (6.1%, a difference of 7.3%), and Ute (6.2%, a difference of 8.2%). Similarly, the demographic groups most similar to Paiute are Hopi (7.5%, a difference of 3.5%), Arapaho (7.5%, a difference of 4.0%), Colville (7.4%, a difference of 5.5%), Apache (7.0%, a difference of 10.7%), and Puerto Rican (6.8%, a difference of 14.4%).
| Demographics | Rating | Rank | Unemployment Among Ages 45 to 54 years |
| Yakama | 0.0 /100 | #321 | Tragic 5.7% |
| Immigrants | Azores | 0.0 /100 | #322 | Tragic 5.7% |
| Immigrants | Cabo Verde | 0.0 /100 | #323 | Tragic 5.9% |
| Natives/Alaskans | 0.0 /100 | #324 | Tragic 6.1% |
| Immigrants | Armenia | 0.0 /100 | #325 | Tragic 6.1% |
| Ute | 0.0 /100 | #326 | Tragic 6.2% |
| Dominicans | 0.0 /100 | #327 | Tragic 6.2% |
| Pueblo | 0.0 /100 | #328 | Tragic 6.2% |
| Alaska Natives | 0.0 /100 | #329 | Tragic 6.3% |
| Immigrants | Dominican Republic | 0.0 /100 | #330 | Tragic 6.3% |
| Tohono O'odham | 0.0 /100 | #331 | Tragic 6.3% |
| Pima | 0.0 /100 | #332 | Tragic 6.4% |
| Immigrants | Yemen | 0.0 /100 | #333 | Tragic 6.5% |
| Sioux | 0.0 /100 | #334 | Tragic 6.6% |
| Navajo | 0.0 /100 | #335 | Tragic 6.7% |
| Puerto Ricans | 0.0 /100 | #336 | Tragic 6.8% |
| Apache | 0.0 /100 | #337 | Tragic 7.0% |
| Colville | 0.0 /100 | #338 | Tragic 7.4% |
| Arapaho | 0.0 /100 | #339 | Tragic 7.5% |
| Hopi | 0.0 /100 | #340 | Tragic 7.5% |
| Paiute | 0.0 /100 | #341 | Tragic 7.8% |