Yakama vs Arapaho Unemployment Among Ages 25 to 29 years
COMPARE
Yakama
Arapaho
Unemployment Among Ages 25 to 29 years
Unemployment Among Ages 25 to 29 years Comparison
Yakama
Arapaho
8.8%
UNEMPLOYMENT AMONG AGES 25 TO 29 YEARS
0.0/ 100
METRIC RATING
325th/ 347
METRIC RANK
15.4%
UNEMPLOYMENT AMONG AGES 25 TO 29 YEARS
0.0/ 100
METRIC RATING
345th/ 347
METRIC RANK
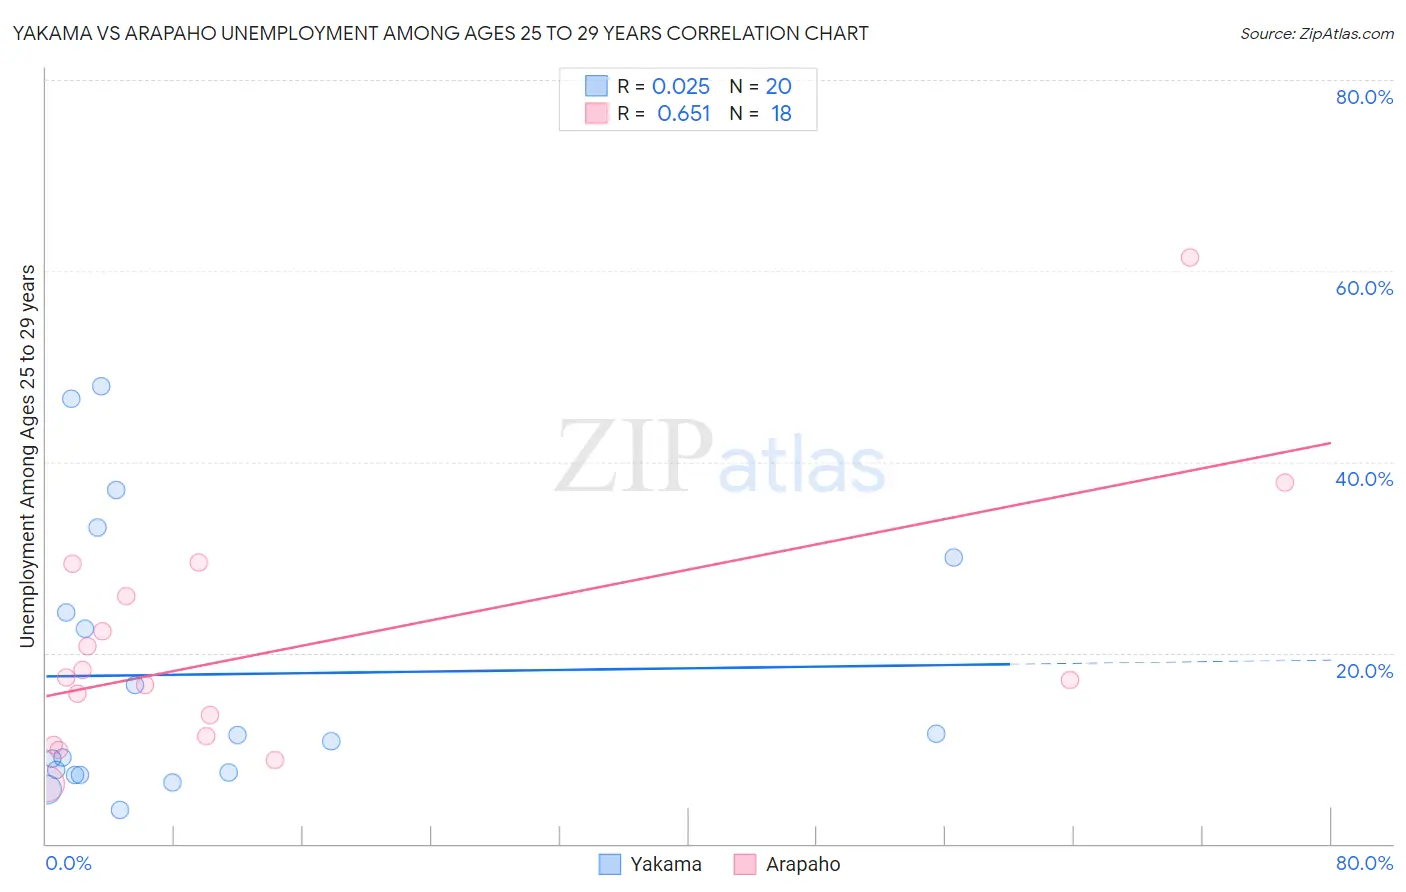
Yakama vs Arapaho Unemployment Among Ages 25 to 29 years Correlation Chart
The statistical analysis conducted on geographies consisting of 19,619,825 people shows no correlation between the proportion of Yakama and unemployment rate among population between the ages 25 and 29 in the United States with a correlation coefficient (R) of 0.025 and weighted average of 8.8%. Similarly, the statistical analysis conducted on geographies consisting of 29,183,247 people shows a significant positive correlation between the proportion of Arapaho and unemployment rate among population between the ages 25 and 29 in the United States with a correlation coefficient (R) of 0.651 and weighted average of 15.4%, a difference of 75.3%.
Unemployment Among Ages 25 to 29 years Correlation Summary
| Measurement | Yakama | Arapaho |
| Minimum | 3.5% | 6.3% |
| Maximum | 47.9% | 61.4% |
| Range | 44.4% | 55.1% |
| Mean | 17.7% | 20.6% |
| Median | 11.1% | 17.2% |
| Interquartile 25% (IQ1) | 7.3% | 11.2% |
| Interquartile 75% (IQ3) | 27.1% | 25.9% |
| Interquartile Range (IQR) | 19.8% | 14.7% |
| Standard Deviation (Sample) | 14.1% | 13.1% |
| Standard Deviation (Population) | 13.7% | 12.7% |
Demographics Similar to Yakama and Arapaho by Unemployment Among Ages 25 to 29 years
In terms of unemployment among ages 25 to 29 years, the demographic groups most similar to Yakama are Shoshone (9.2%, a difference of 5.3%), Colville (9.2%, a difference of 5.5%), Apache (9.5%, a difference of 8.2%), Aleut (9.7%, a difference of 10.6%), and Native/Alaskan (9.8%, a difference of 12.1%). Similarly, the demographic groups most similar to Arapaho are Hopi (13.5%, a difference of 13.7%), Inupiat (13.4%, a difference of 14.4%), Navajo (12.2%, a difference of 26.2%), Tohono O'odham (12.1%, a difference of 27.2%), and Cheyenne (11.8%, a difference of 29.9%).
| Demographics | Rating | Rank | Unemployment Among Ages 25 to 29 years |
| Yakama | 0.0 /100 | #325 | Tragic 8.8% |
| Shoshone | 0.0 /100 | #326 | Tragic 9.2% |
| Colville | 0.0 /100 | #327 | Tragic 9.2% |
| Apache | 0.0 /100 | #328 | Tragic 9.5% |
| Aleuts | 0.0 /100 | #329 | Tragic 9.7% |
| Natives/Alaskans | 0.0 /100 | #330 | Tragic 9.8% |
| Alaska Natives | 0.0 /100 | #331 | Tragic 10.2% |
| Pueblo | 0.0 /100 | #332 | Tragic 10.4% |
| Alaskan Athabascans | 0.0 /100 | #333 | Tragic 10.8% |
| Yuman | 0.0 /100 | #334 | Tragic 11.0% |
| Puerto Ricans | 0.0 /100 | #335 | Tragic 11.1% |
| Lumbee | 0.0 /100 | #336 | Tragic 11.2% |
| Menominee | 0.0 /100 | #337 | Tragic 11.3% |
| Sioux | 0.0 /100 | #338 | Tragic 11.7% |
| Pima | 0.0 /100 | #339 | Tragic 11.8% |
| Cheyenne | 0.0 /100 | #340 | Tragic 11.8% |
| Tohono O'odham | 0.0 /100 | #341 | Tragic 12.1% |
| Navajo | 0.0 /100 | #342 | Tragic 12.2% |
| Inupiat | 0.0 /100 | #343 | Tragic 13.4% |
| Hopi | 0.0 /100 | #344 | Tragic 13.5% |
| Arapaho | 0.0 /100 | #345 | Tragic 15.4% |