Jordanian vs Arapaho Unemployment Among Ages 25 to 29 years
COMPARE
Jordanian
Arapaho
Unemployment Among Ages 25 to 29 years
Unemployment Among Ages 25 to 29 years Comparison
Jordanians
Arapaho
6.1%
UNEMPLOYMENT AMONG AGES 25 TO 29 YEARS
99.3/ 100
METRIC RATING
42nd/ 347
METRIC RANK
15.4%
UNEMPLOYMENT AMONG AGES 25 TO 29 YEARS
0.0/ 100
METRIC RATING
345th/ 347
METRIC RANK
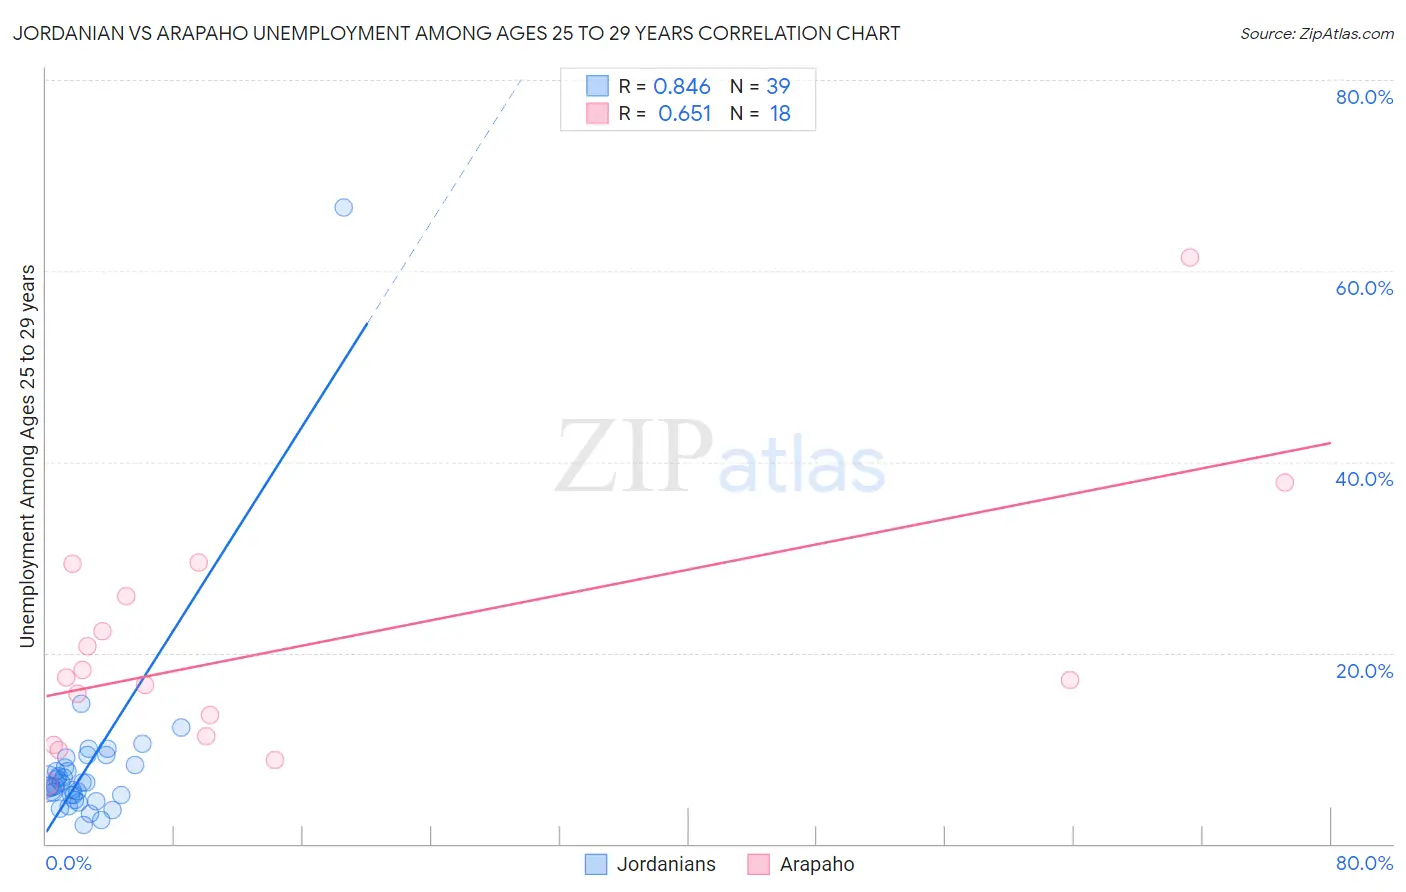
Jordanian vs Arapaho Unemployment Among Ages 25 to 29 years Correlation Chart
The statistical analysis conducted on geographies consisting of 164,069,311 people shows a very strong positive correlation between the proportion of Jordanians and unemployment rate among population between the ages 25 and 29 in the United States with a correlation coefficient (R) of 0.846 and weighted average of 6.1%. Similarly, the statistical analysis conducted on geographies consisting of 29,183,247 people shows a significant positive correlation between the proportion of Arapaho and unemployment rate among population between the ages 25 and 29 in the United States with a correlation coefficient (R) of 0.651 and weighted average of 15.4%, a difference of 149.9%.
Unemployment Among Ages 25 to 29 years Correlation Summary
| Measurement | Jordanian | Arapaho |
| Minimum | 2.0% | 6.3% |
| Maximum | 66.7% | 61.4% |
| Range | 64.7% | 55.1% |
| Mean | 8.1% | 20.6% |
| Median | 6.2% | 17.2% |
| Interquartile 25% (IQ1) | 5.1% | 11.2% |
| Interquartile 75% (IQ3) | 8.2% | 25.9% |
| Interquartile Range (IQR) | 3.1% | 14.7% |
| Standard Deviation (Sample) | 10.0% | 13.1% |
| Standard Deviation (Population) | 9.8% | 12.7% |
Similar Demographics by Unemployment Among Ages 25 to 29 years
Demographics Similar to Jordanians by Unemployment Among Ages 25 to 29 years
In terms of unemployment among ages 25 to 29 years, the demographic groups most similar to Jordanians are Fijian (6.1%, a difference of 0.030%), Immigrants from Kenya (6.1%, a difference of 0.070%), Czech (6.2%, a difference of 0.13%), Mongolian (6.2%, a difference of 0.18%), and Indonesian (6.1%, a difference of 0.20%).
| Demographics | Rating | Rank | Unemployment Among Ages 25 to 29 years |
| Immigrants | Zimbabwe | 99.5 /100 | #35 | Exceptional 6.1% |
| Taiwanese | 99.5 /100 | #36 | Exceptional 6.1% |
| Immigrants | Serbia | 99.5 /100 | #37 | Exceptional 6.1% |
| Ethiopians | 99.4 /100 | #38 | Exceptional 6.1% |
| Indonesians | 99.3 /100 | #39 | Exceptional 6.1% |
| Immigrants | Kenya | 99.3 /100 | #40 | Exceptional 6.1% |
| Fijians | 99.3 /100 | #41 | Exceptional 6.1% |
| Jordanians | 99.3 /100 | #42 | Exceptional 6.1% |
| Czechs | 99.2 /100 | #43 | Exceptional 6.2% |
| Mongolians | 99.2 /100 | #44 | Exceptional 6.2% |
| Venezuelans | 99.1 /100 | #45 | Exceptional 6.2% |
| Immigrants | Lithuania | 99.0 /100 | #46 | Exceptional 6.2% |
| Latvians | 99.0 /100 | #47 | Exceptional 6.2% |
| Immigrants | Australia | 99.0 /100 | #48 | Exceptional 6.2% |
| German Russians | 99.0 /100 | #49 | Exceptional 6.2% |
Demographics Similar to Arapaho by Unemployment Among Ages 25 to 29 years
In terms of unemployment among ages 25 to 29 years, the demographic groups most similar to Arapaho are Crow (15.4%, a difference of 0.070%), Hopi (13.5%, a difference of 13.7%), Inupiat (13.4%, a difference of 14.4%), Yup'ik (17.9%, a difference of 16.6%), and Navajo (12.2%, a difference of 26.2%).
| Demographics | Rating | Rank | Unemployment Among Ages 25 to 29 years |
| Alaskan Athabascans | 0.0 /100 | #333 | Tragic 10.8% |
| Yuman | 0.0 /100 | #334 | Tragic 11.0% |
| Puerto Ricans | 0.0 /100 | #335 | Tragic 11.1% |
| Lumbee | 0.0 /100 | #336 | Tragic 11.2% |
| Menominee | 0.0 /100 | #337 | Tragic 11.3% |
| Sioux | 0.0 /100 | #338 | Tragic 11.7% |
| Pima | 0.0 /100 | #339 | Tragic 11.8% |
| Cheyenne | 0.0 /100 | #340 | Tragic 11.8% |
| Tohono O'odham | 0.0 /100 | #341 | Tragic 12.1% |
| Navajo | 0.0 /100 | #342 | Tragic 12.2% |
| Inupiat | 0.0 /100 | #343 | Tragic 13.4% |
| Hopi | 0.0 /100 | #344 | Tragic 13.5% |
| Arapaho | 0.0 /100 | #345 | Tragic 15.4% |
| Crow | 0.0 /100 | #346 | Tragic 15.4% |
| Yup'ik | 0.0 /100 | #347 | Tragic 17.9% |