Immigrants from Cabo Verde vs Arapaho Unemployment Among Ages 25 to 29 years
COMPARE
Immigrants from Cabo Verde
Arapaho
Unemployment Among Ages 25 to 29 years
Unemployment Among Ages 25 to 29 years Comparison
Immigrants from Cabo Verde
Arapaho
6.8%
UNEMPLOYMENT AMONG AGES 25 TO 29 YEARS
16.2/ 100
METRIC RATING
212th/ 347
METRIC RANK
15.4%
UNEMPLOYMENT AMONG AGES 25 TO 29 YEARS
0.0/ 100
METRIC RATING
345th/ 347
METRIC RANK
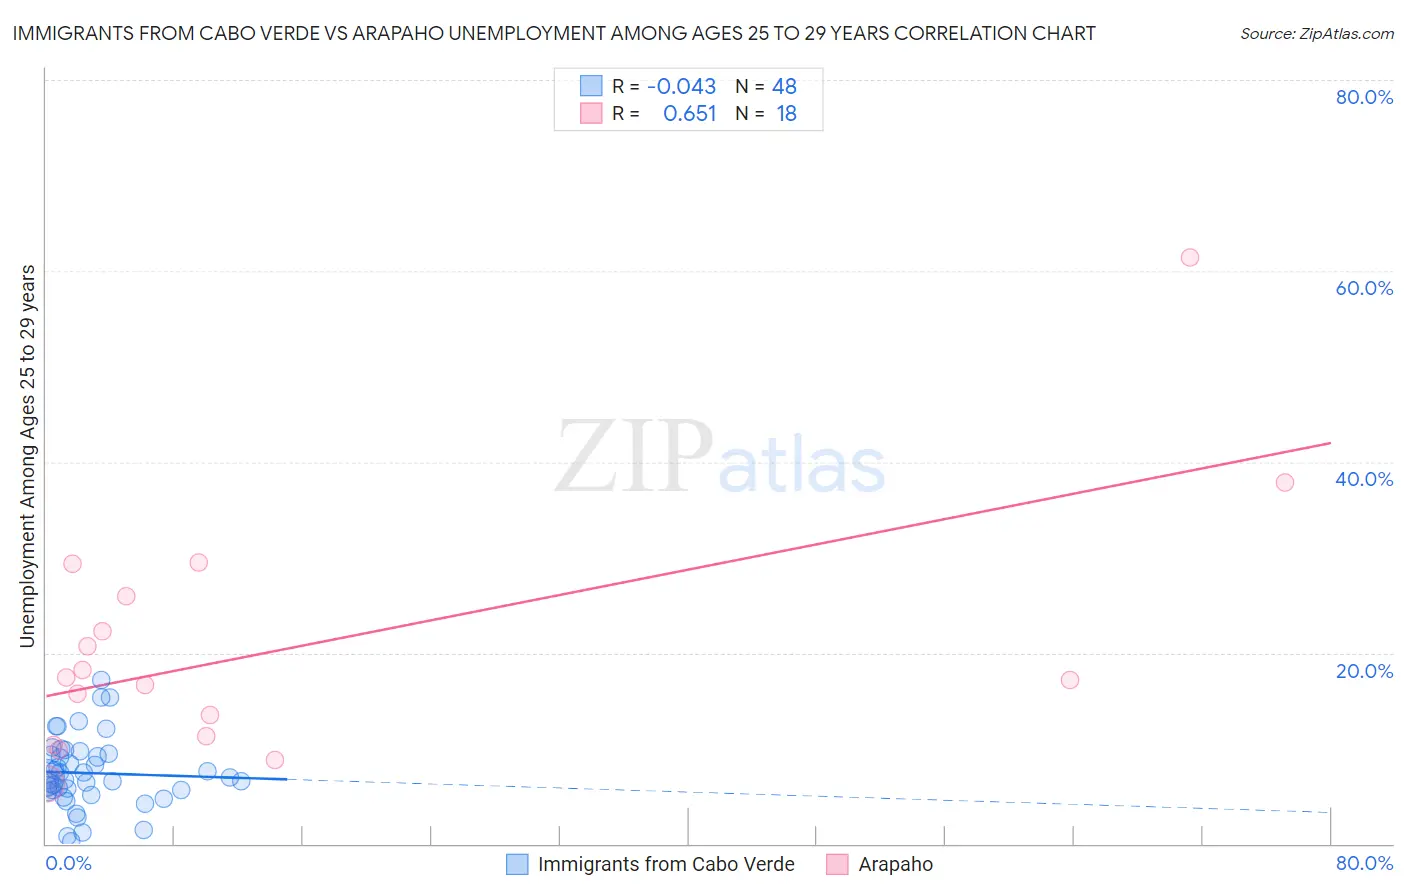
Immigrants from Cabo Verde vs Arapaho Unemployment Among Ages 25 to 29 years Correlation Chart
The statistical analysis conducted on geographies consisting of 37,701,958 people shows no correlation between the proportion of Immigrants from Cabo Verde and unemployment rate among population between the ages 25 and 29 in the United States with a correlation coefficient (R) of -0.043 and weighted average of 6.8%. Similarly, the statistical analysis conducted on geographies consisting of 29,183,247 people shows a significant positive correlation between the proportion of Arapaho and unemployment rate among population between the ages 25 and 29 in the United States with a correlation coefficient (R) of 0.651 and weighted average of 15.4%, a difference of 125.3%.
Unemployment Among Ages 25 to 29 years Correlation Summary
| Measurement | Immigrants from Cabo Verde | Arapaho |
| Minimum | 0.30% | 6.3% |
| Maximum | 17.2% | 61.4% |
| Range | 16.9% | 55.1% |
| Mean | 7.4% | 20.6% |
| Median | 6.9% | 17.2% |
| Interquartile 25% (IQ1) | 5.6% | 11.2% |
| Interquartile 75% (IQ3) | 9.3% | 25.9% |
| Interquartile Range (IQR) | 3.8% | 14.7% |
| Standard Deviation (Sample) | 3.7% | 13.1% |
| Standard Deviation (Population) | 3.6% | 12.7% |
Similar Demographics by Unemployment Among Ages 25 to 29 years
Demographics Similar to Immigrants from Cabo Verde by Unemployment Among Ages 25 to 29 years
In terms of unemployment among ages 25 to 29 years, the demographic groups most similar to Immigrants from Cabo Verde are Immigrants from Philippines (6.8%, a difference of 0.050%), Canadian (6.8%, a difference of 0.080%), Hawaiian (6.8%, a difference of 0.10%), Immigrants from Syria (6.8%, a difference of 0.12%), and Liberian (6.8%, a difference of 0.17%).
| Demographics | Rating | Rank | Unemployment Among Ages 25 to 29 years |
| Immigrants | England | 19.8 /100 | #205 | Poor 6.8% |
| Ugandans | 19.8 /100 | #206 | Poor 6.8% |
| Immigrants | Denmark | 19.0 /100 | #207 | Poor 6.8% |
| Immigrants | Germany | 18.8 /100 | #208 | Poor 6.8% |
| Hawaiians | 17.1 /100 | #209 | Poor 6.8% |
| Canadians | 16.9 /100 | #210 | Poor 6.8% |
| Immigrants | Philippines | 16.7 /100 | #211 | Poor 6.8% |
| Immigrants | Cabo Verde | 16.2 /100 | #212 | Poor 6.8% |
| Immigrants | Syria | 15.1 /100 | #213 | Poor 6.8% |
| Liberians | 14.7 /100 | #214 | Poor 6.8% |
| Spanish | 14.4 /100 | #215 | Poor 6.8% |
| Slovaks | 14.3 /100 | #216 | Poor 6.8% |
| Ute | 13.4 /100 | #217 | Poor 6.8% |
| Immigrants | Austria | 12.3 /100 | #218 | Poor 6.8% |
| Whites/Caucasians | 10.6 /100 | #219 | Poor 6.9% |
Demographics Similar to Arapaho by Unemployment Among Ages 25 to 29 years
In terms of unemployment among ages 25 to 29 years, the demographic groups most similar to Arapaho are Crow (15.4%, a difference of 0.070%), Hopi (13.5%, a difference of 13.7%), Inupiat (13.4%, a difference of 14.4%), Yup'ik (17.9%, a difference of 16.6%), and Navajo (12.2%, a difference of 26.2%).
| Demographics | Rating | Rank | Unemployment Among Ages 25 to 29 years |
| Alaskan Athabascans | 0.0 /100 | #333 | Tragic 10.8% |
| Yuman | 0.0 /100 | #334 | Tragic 11.0% |
| Puerto Ricans | 0.0 /100 | #335 | Tragic 11.1% |
| Lumbee | 0.0 /100 | #336 | Tragic 11.2% |
| Menominee | 0.0 /100 | #337 | Tragic 11.3% |
| Sioux | 0.0 /100 | #338 | Tragic 11.7% |
| Pima | 0.0 /100 | #339 | Tragic 11.8% |
| Cheyenne | 0.0 /100 | #340 | Tragic 11.8% |
| Tohono O'odham | 0.0 /100 | #341 | Tragic 12.1% |
| Navajo | 0.0 /100 | #342 | Tragic 12.2% |
| Inupiat | 0.0 /100 | #343 | Tragic 13.4% |
| Hopi | 0.0 /100 | #344 | Tragic 13.5% |
| Arapaho | 0.0 /100 | #345 | Tragic 15.4% |
| Crow | 0.0 /100 | #346 | Tragic 15.4% |
| Yup'ik | 0.0 /100 | #347 | Tragic 17.9% |