Haitian vs Albanian Unemployment Among Ages 16 to 19 years
COMPARE
Haitian
Albanian
Unemployment Among Ages 16 to 19 years
Unemployment Among Ages 16 to 19 years Comparison
Haitians
Albanians
20.5%
UNEMPLOYMENT AMONG AGES 16 TO 19 YEARS
0.0/ 100
METRIC RATING
298th/ 347
METRIC RANK
18.2%
UNEMPLOYMENT AMONG AGES 16 TO 19 YEARS
5.8/ 100
METRIC RATING
229th/ 347
METRIC RANK
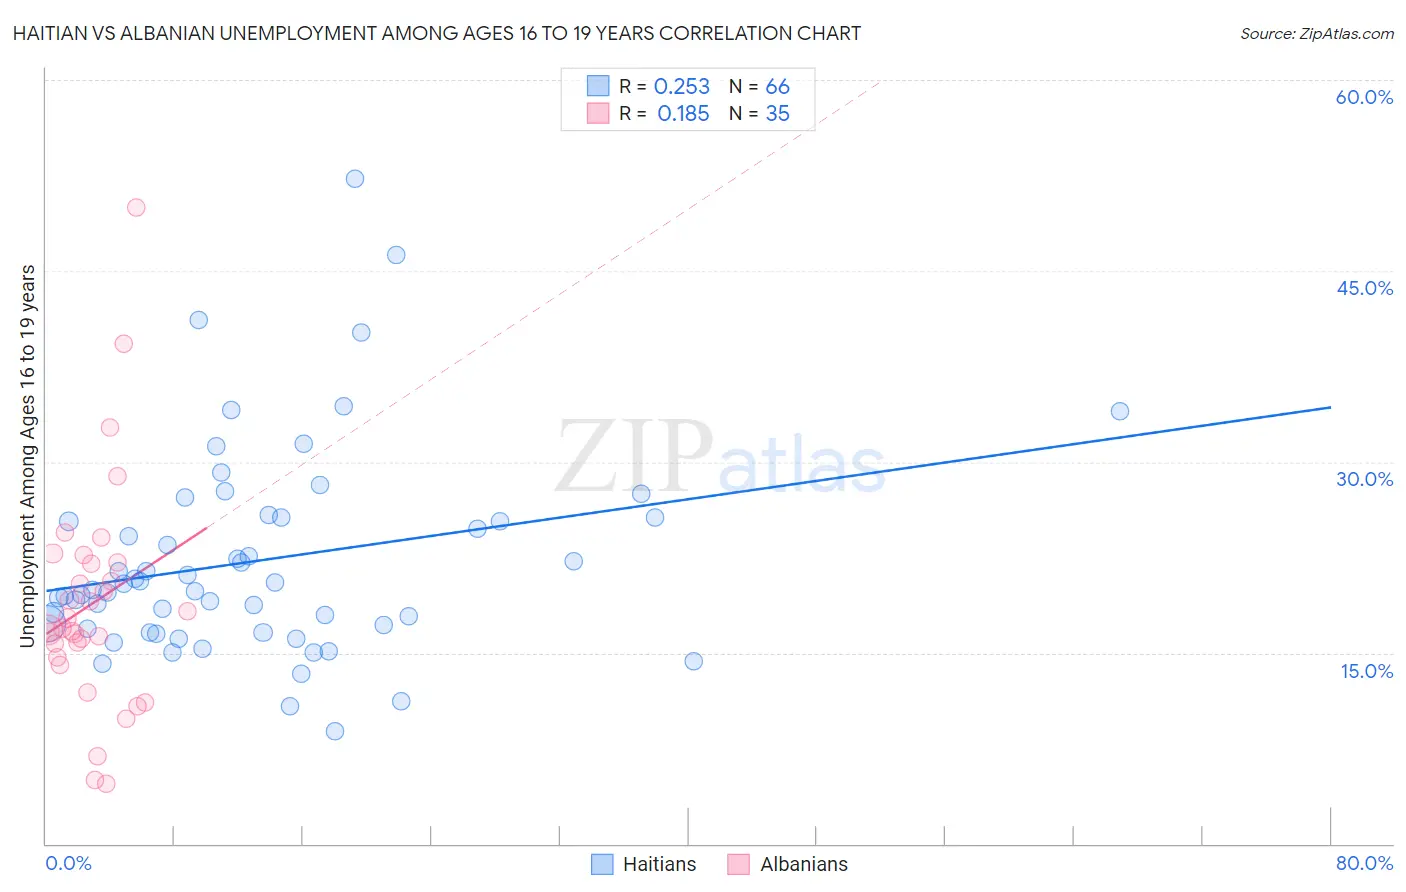
Haitian vs Albanian Unemployment Among Ages 16 to 19 years Correlation Chart
The statistical analysis conducted on geographies consisting of 276,876,873 people shows a weak positive correlation between the proportion of Haitians and unemployment rate among population between the ages 16 and 19 in the United States with a correlation coefficient (R) of 0.253 and weighted average of 20.5%. Similarly, the statistical analysis conducted on geographies consisting of 186,358,251 people shows a poor positive correlation between the proportion of Albanians and unemployment rate among population between the ages 16 and 19 in the United States with a correlation coefficient (R) of 0.185 and weighted average of 18.2%, a difference of 13.0%.
Unemployment Among Ages 16 to 19 years Correlation Summary
| Measurement | Haitian | Albanian |
| Minimum | 8.8% | 4.7% |
| Maximum | 52.3% | 50.0% |
| Range | 43.5% | 45.3% |
| Mean | 22.2% | 18.9% |
| Median | 20.2% | 16.9% |
| Interquartile 25% (IQ1) | 16.9% | 14.7% |
| Interquartile 75% (IQ3) | 25.6% | 22.1% |
| Interquartile Range (IQR) | 8.7% | 7.4% |
| Standard Deviation (Sample) | 8.1% | 8.9% |
| Standard Deviation (Population) | 8.1% | 8.8% |
Similar Demographics by Unemployment Among Ages 16 to 19 years
Demographics Similar to Haitians by Unemployment Among Ages 16 to 19 years
In terms of unemployment among ages 16 to 19 years, the demographic groups most similar to Haitians are Immigrants from Uzbekistan (20.5%, a difference of 0.050%), Alsatian (20.5%, a difference of 0.060%), Armenian (20.5%, a difference of 0.080%), Ecuadorian (20.5%, a difference of 0.14%), and Central American Indian (20.4%, a difference of 0.38%).
| Demographics | Rating | Rank | Unemployment Among Ages 16 to 19 years |
| Immigrants | Yemen | 0.0 /100 | #291 | Tragic 20.0% |
| Comanche | 0.0 /100 | #292 | Tragic 20.2% |
| Immigrants | Bahamas | 0.0 /100 | #293 | Tragic 20.4% |
| Immigrants | Haiti | 0.0 /100 | #294 | Tragic 20.4% |
| Central American Indians | 0.0 /100 | #295 | Tragic 20.4% |
| Armenians | 0.0 /100 | #296 | Tragic 20.5% |
| Alsatians | 0.0 /100 | #297 | Tragic 20.5% |
| Haitians | 0.0 /100 | #298 | Tragic 20.5% |
| Immigrants | Uzbekistan | 0.0 /100 | #299 | Tragic 20.5% |
| Ecuadorians | 0.0 /100 | #300 | Tragic 20.5% |
| Immigrants | Ecuador | 0.0 /100 | #301 | Tragic 20.9% |
| Immigrants | Caribbean | 0.0 /100 | #302 | Tragic 20.9% |
| Senegalese | 0.0 /100 | #303 | Tragic 21.0% |
| Aleuts | 0.0 /100 | #304 | Tragic 21.2% |
| Immigrants | Senegal | 0.0 /100 | #305 | Tragic 21.2% |
Demographics Similar to Albanians by Unemployment Among Ages 16 to 19 years
In terms of unemployment among ages 16 to 19 years, the demographic groups most similar to Albanians are Immigrants from Greece (18.1%, a difference of 0.25%), Immigrants from Liberia (18.1%, a difference of 0.26%), Spanish American (18.2%, a difference of 0.26%), Immigrants from Belgium (18.1%, a difference of 0.28%), and Immigrants from Chile (18.1%, a difference of 0.32%).
| Demographics | Rating | Rank | Unemployment Among Ages 16 to 19 years |
| Immigrants | Iran | 10.7 /100 | #222 | Poor 18.0% |
| Immigrants | Western Asia | 10.2 /100 | #223 | Poor 18.0% |
| Immigrants | Serbia | 8.3 /100 | #224 | Tragic 18.1% |
| Immigrants | Chile | 7.5 /100 | #225 | Tragic 18.1% |
| Immigrants | Belgium | 7.3 /100 | #226 | Tragic 18.1% |
| Immigrants | Liberia | 7.1 /100 | #227 | Tragic 18.1% |
| Immigrants | Greece | 7.1 /100 | #228 | Tragic 18.1% |
| Albanians | 5.8 /100 | #229 | Tragic 18.2% |
| Spanish Americans | 4.7 /100 | #230 | Tragic 18.2% |
| Nepalese | 4.2 /100 | #231 | Tragic 18.2% |
| Immigrants | Russia | 4.0 /100 | #232 | Tragic 18.2% |
| Seminole | 4.0 /100 | #233 | Tragic 18.2% |
| Colombians | 3.7 /100 | #234 | Tragic 18.3% |
| French American Indians | 2.9 /100 | #235 | Tragic 18.3% |
| Immigrants | Colombia | 2.7 /100 | #236 | Tragic 18.3% |