Blackfeet vs Immigrants from Bangladesh Unemployment Among Ages 25 to 29 years
COMPARE
Blackfeet
Immigrants from Bangladesh
Unemployment Among Ages 25 to 29 years
Unemployment Among Ages 25 to 29 years Comparison
Blackfeet
Immigrants from Bangladesh
7.9%
UNEMPLOYMENT AMONG AGES 25 TO 29 YEARS
0.0/ 100
METRIC RATING
297th/ 347
METRIC RANK
7.5%
UNEMPLOYMENT AMONG AGES 25 TO 29 YEARS
0.0/ 100
METRIC RATING
281st/ 347
METRIC RANK
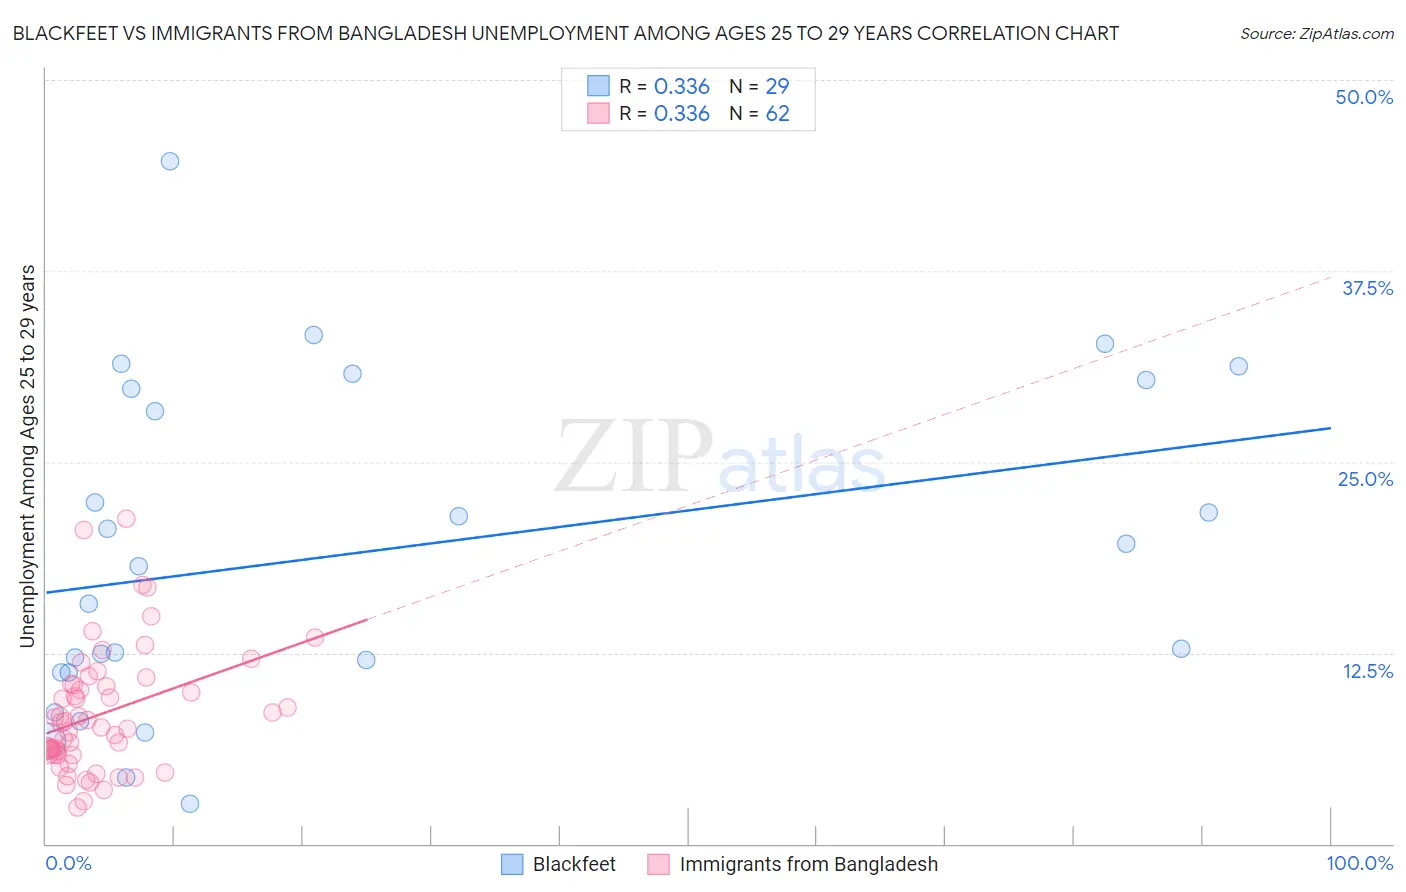
Blackfeet vs Immigrants from Bangladesh Unemployment Among Ages 25 to 29 years Correlation Chart
The statistical analysis conducted on geographies consisting of 297,062,575 people shows a mild positive correlation between the proportion of Blackfeet and unemployment rate among population between the ages 25 and 29 in the United States with a correlation coefficient (R) of 0.336 and weighted average of 7.9%. Similarly, the statistical analysis conducted on geographies consisting of 199,836,373 people shows a mild positive correlation between the proportion of Immigrants from Bangladesh and unemployment rate among population between the ages 25 and 29 in the United States with a correlation coefficient (R) of 0.336 and weighted average of 7.5%, a difference of 4.2%.
Unemployment Among Ages 25 to 29 years Correlation Summary
| Measurement | Blackfeet | Immigrants from Bangladesh |
| Minimum | 2.6% | 2.4% |
| Maximum | 44.7% | 21.3% |
| Range | 42.1% | 18.9% |
| Mean | 19.1% | 8.5% |
| Median | 18.2% | 7.8% |
| Interquartile 25% (IQ1) | 11.2% | 5.8% |
| Interquartile 75% (IQ3) | 30.1% | 10.4% |
| Interquartile Range (IQR) | 18.9% | 4.6% |
| Standard Deviation (Sample) | 10.7% | 4.0% |
| Standard Deviation (Population) | 10.5% | 4.0% |
Demographics Similar to Blackfeet and Immigrants from Bangladesh by Unemployment Among Ages 25 to 29 years
In terms of unemployment among ages 25 to 29 years, the demographic groups most similar to Blackfeet are Immigrants from Trinidad and Tobago (7.9%, a difference of 0.26%), Immigrants from West Indies (7.8%, a difference of 0.42%), Barbadian (7.9%, a difference of 0.43%), Comanche (7.8%, a difference of 0.55%), and Trinidadian and Tobagonian (7.8%, a difference of 1.0%). Similarly, the demographic groups most similar to Immigrants from Bangladesh are Immigrants from Caribbean (7.5%, a difference of 0.090%), Immigrants from Senegal (7.6%, a difference of 0.17%), Nepalese (7.5%, a difference of 0.23%), Creek (7.6%, a difference of 0.34%), and Cherokee (7.6%, a difference of 0.35%).
| Demographics | Rating | Rank | Unemployment Among Ages 25 to 29 years |
| Nepalese | 0.0 /100 | #279 | Tragic 7.5% |
| Immigrants | Caribbean | 0.0 /100 | #280 | Tragic 7.5% |
| Immigrants | Bangladesh | 0.0 /100 | #281 | Tragic 7.5% |
| Immigrants | Senegal | 0.0 /100 | #282 | Tragic 7.6% |
| Creek | 0.0 /100 | #283 | Tragic 7.6% |
| Cherokee | 0.0 /100 | #284 | Tragic 7.6% |
| Senegalese | 0.0 /100 | #285 | Tragic 7.6% |
| Vietnamese | 0.0 /100 | #286 | Tragic 7.6% |
| Immigrants | Mexico | 0.0 /100 | #287 | Tragic 7.6% |
| Africans | 0.0 /100 | #288 | Tragic 7.6% |
| Belizeans | 0.0 /100 | #289 | Tragic 7.7% |
| Armenians | 0.0 /100 | #290 | Tragic 7.7% |
| Hispanics or Latinos | 0.0 /100 | #291 | Tragic 7.7% |
| Chippewa | 0.0 /100 | #292 | Tragic 7.8% |
| Immigrants | Belize | 0.0 /100 | #293 | Tragic 7.8% |
| Trinidadians and Tobagonians | 0.0 /100 | #294 | Tragic 7.8% |
| Comanche | 0.0 /100 | #295 | Tragic 7.8% |
| Immigrants | West Indies | 0.0 /100 | #296 | Tragic 7.8% |
| Blackfeet | 0.0 /100 | #297 | Tragic 7.9% |
| Immigrants | Trinidad and Tobago | 0.0 /100 | #298 | Tragic 7.9% |
| Barbadians | 0.0 /100 | #299 | Tragic 7.9% |