White/Caucasian vs Venezuelan Unemployment Among Women with Children Under 18 years
COMPARE
White/Caucasian
Venezuelan
Unemployment Among Women with Children Under 18 years
Unemployment Among Women with Children Under 18 years Comparison
Whites/Caucasians
Venezuelans
5.3%
UNEMPLOYMENT AMONG WOMEN WITH CHILDREN UNDER 18 YEARS
82.9/ 100
METRIC RATING
127th/ 347
METRIC RANK
5.3%
UNEMPLOYMENT AMONG WOMEN WITH CHILDREN UNDER 18 YEARS
76.0/ 100
METRIC RATING
141st/ 347
METRIC RANK
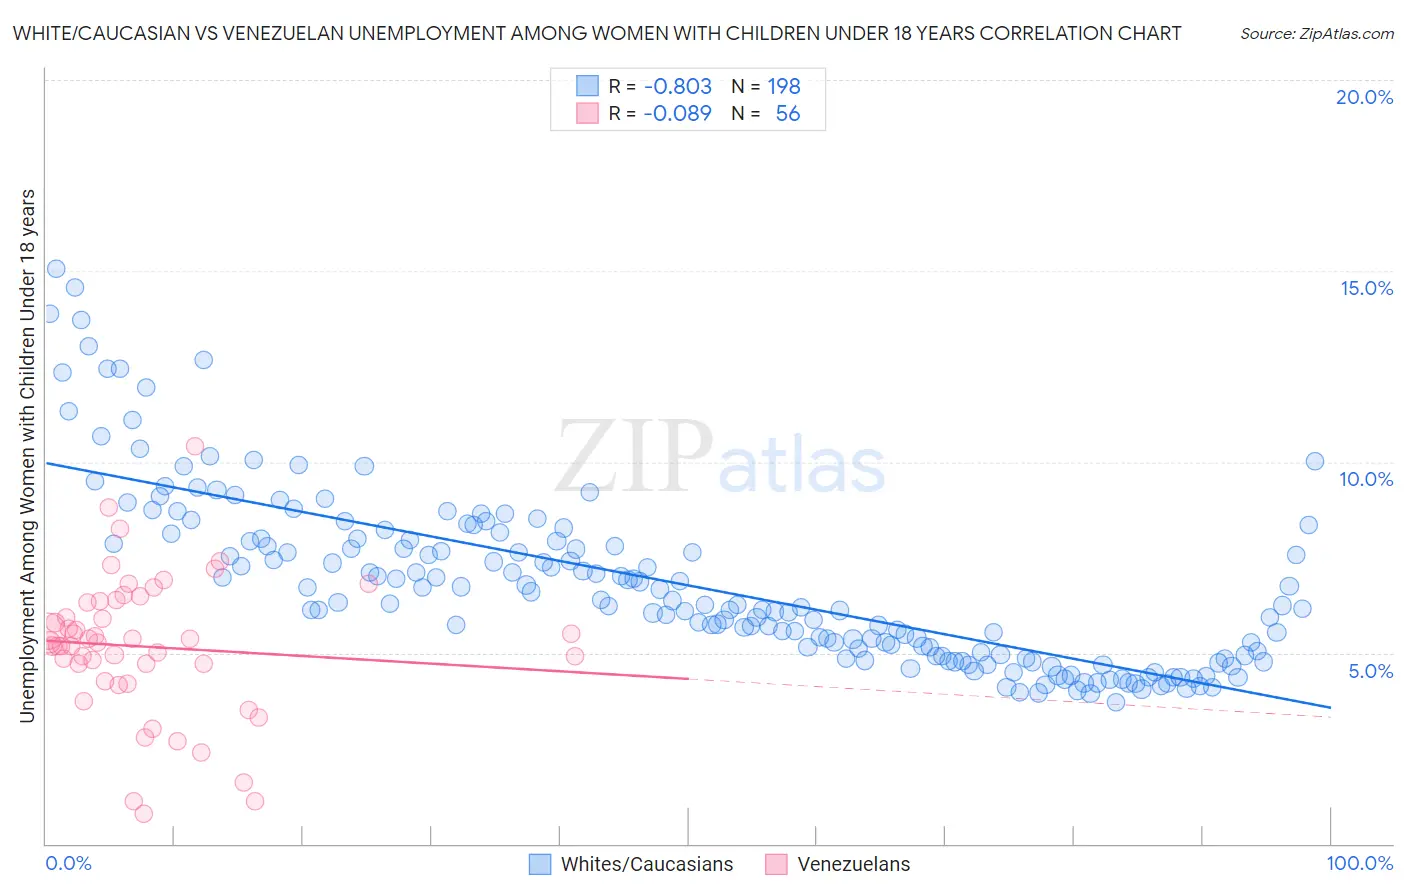
White/Caucasian vs Venezuelan Unemployment Among Women with Children Under 18 years Correlation Chart
The statistical analysis conducted on geographies consisting of 523,047,491 people shows a very strong negative correlation between the proportion of Whites/Caucasians and unemployment rate among women with children under the age of 18 in the United States with a correlation coefficient (R) of -0.803 and weighted average of 5.3%. Similarly, the statistical analysis conducted on geographies consisting of 298,794,110 people shows a slight negative correlation between the proportion of Venezuelans and unemployment rate among women with children under the age of 18 in the United States with a correlation coefficient (R) of -0.089 and weighted average of 5.3%, a difference of 0.78%.
Unemployment Among Women with Children Under 18 years Correlation Summary
| Measurement | White/Caucasian | Venezuelan |
| Minimum | 3.7% | 0.80% |
| Maximum | 15.1% | 10.4% |
| Range | 11.4% | 9.6% |
| Mean | 6.8% | 5.2% |
| Median | 6.2% | 5.3% |
| Interquartile 25% (IQ1) | 4.9% | 4.5% |
| Interquartile 75% (IQ3) | 8.0% | 6.3% |
| Interquartile Range (IQR) | 3.0% | 1.8% |
| Standard Deviation (Sample) | 2.3% | 1.8% |
| Standard Deviation (Population) | 2.3% | 1.8% |
Demographics Similar to Whites/Caucasians and Venezuelans by Unemployment Among Women with Children Under 18 years
In terms of unemployment among women with children under 18 years, the demographic groups most similar to Whites/Caucasians are Immigrants from South Africa (5.3%, a difference of 0.010%), Immigrants from Oceania (5.3%, a difference of 0.030%), Immigrants from North Macedonia (5.3%, a difference of 0.040%), Immigrants from Italy (5.3%, a difference of 0.070%), and Immigrants from Austria (5.3%, a difference of 0.10%). Similarly, the demographic groups most similar to Venezuelans are Immigrants from Norway (5.3%, a difference of 0.020%), Immigrants from Venezuela (5.3%, a difference of 0.060%), Chilean (5.3%, a difference of 0.10%), Immigrants from England (5.3%, a difference of 0.11%), and Immigrants from Ukraine (5.3%, a difference of 0.26%).
| Demographics | Rating | Rank | Unemployment Among Women with Children Under 18 years |
| Native Hawaiians | 84.0 /100 | #124 | Excellent 5.3% |
| Immigrants | North Macedonia | 83.2 /100 | #125 | Excellent 5.3% |
| Immigrants | Oceania | 83.1 /100 | #126 | Excellent 5.3% |
| Whites/Caucasians | 82.9 /100 | #127 | Excellent 5.3% |
| Immigrants | South Africa | 82.8 /100 | #128 | Excellent 5.3% |
| Immigrants | Italy | 82.3 /100 | #129 | Excellent 5.3% |
| Immigrants | Austria | 82.1 /100 | #130 | Excellent 5.3% |
| Immigrants | Israel | 81.9 /100 | #131 | Excellent 5.3% |
| Immigrants | Ethiopia | 81.4 /100 | #132 | Excellent 5.3% |
| Ethiopians | 80.7 /100 | #133 | Excellent 5.3% |
| Slovaks | 80.5 /100 | #134 | Excellent 5.3% |
| New Zealanders | 79.9 /100 | #135 | Good 5.3% |
| Immigrants | Jordan | 79.5 /100 | #136 | Good 5.3% |
| Jordanians | 78.8 /100 | #137 | Good 5.3% |
| Argentineans | 78.8 /100 | #138 | Good 5.3% |
| Immigrants | Ukraine | 78.5 /100 | #139 | Good 5.3% |
| Immigrants | Norway | 76.2 /100 | #140 | Good 5.3% |
| Venezuelans | 76.0 /100 | #141 | Good 5.3% |
| Immigrants | Venezuela | 75.4 /100 | #142 | Good 5.3% |
| Chileans | 75.0 /100 | #143 | Good 5.3% |
| Immigrants | England | 74.9 /100 | #144 | Good 5.3% |