West Indian vs Filipino Unemployment Among Youth under 25 years
COMPARE
West Indian
Filipino
Unemployment Among Youth under 25 years
Unemployment Among Youth under 25 years Comparison
West Indians
Filipinos
14.6%
UNEMPLOYMENT AMONG YOUTH UNDER 25 YEARS
0.0/ 100
METRIC RATING
319th/ 347
METRIC RANK
11.1%
UNEMPLOYMENT AMONG YOUTH UNDER 25 YEARS
98.3/ 100
METRIC RATING
61st/ 347
METRIC RANK
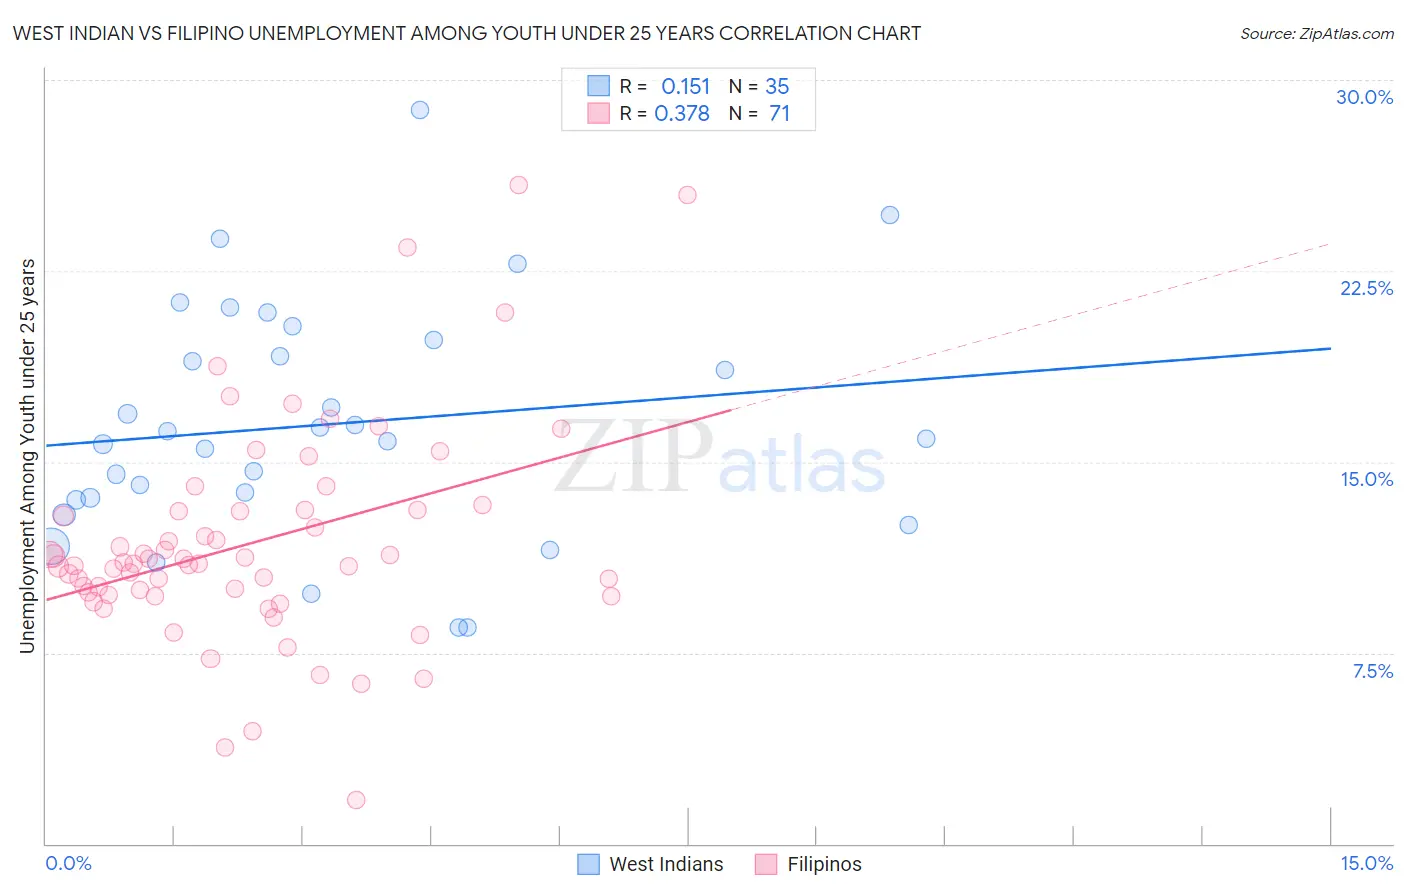
West Indian vs Filipino Unemployment Among Youth under 25 years Correlation Chart
The statistical analysis conducted on geographies consisting of 252,611,968 people shows a poor positive correlation between the proportion of West Indians and unemployment rate among youth under the age of 25 in the United States with a correlation coefficient (R) of 0.151 and weighted average of 14.6%. Similarly, the statistical analysis conducted on geographies consisting of 253,048,092 people shows a mild positive correlation between the proportion of Filipinos and unemployment rate among youth under the age of 25 in the United States with a correlation coefficient (R) of 0.378 and weighted average of 11.1%, a difference of 31.1%.
Unemployment Among Youth under 25 years Correlation Summary
| Measurement | West Indian | Filipino |
| Minimum | 8.5% | 1.7% |
| Maximum | 28.8% | 25.9% |
| Range | 20.3% | 24.2% |
| Mean | 16.5% | 11.8% |
| Median | 15.9% | 11.0% |
| Interquartile 25% (IQ1) | 13.5% | 9.8% |
| Interquartile 75% (IQ3) | 19.8% | 13.1% |
| Interquartile Range (IQR) | 6.3% | 3.4% |
| Standard Deviation (Sample) | 4.7% | 4.3% |
| Standard Deviation (Population) | 4.6% | 4.3% |
Similar Demographics by Unemployment Among Youth under 25 years
Demographics Similar to West Indians by Unemployment Among Youth under 25 years
In terms of unemployment among youth under 25 years, the demographic groups most similar to West Indians are Immigrants from Dominica (14.6%, a difference of 0.040%), Barbadian (14.6%, a difference of 0.040%), Cheyenne (14.6%, a difference of 0.20%), Trinidadian and Tobagonian (14.6%, a difference of 0.27%), and Immigrants from Trinidad and Tobago (14.6%, a difference of 0.36%).
| Demographics | Rating | Rank | Unemployment Among Youth under 25 years |
| Vietnamese | 0.0 /100 | #312 | Tragic 14.3% |
| Immigrants | Armenia | 0.0 /100 | #313 | Tragic 14.4% |
| Jamaicans | 0.0 /100 | #314 | Tragic 14.4% |
| Sioux | 0.0 /100 | #315 | Tragic 14.4% |
| Natives/Alaskans | 0.0 /100 | #316 | Tragic 14.5% |
| Blacks/African Americans | 0.0 /100 | #317 | Tragic 14.5% |
| Immigrants | Dominica | 0.0 /100 | #318 | Tragic 14.6% |
| West Indians | 0.0 /100 | #319 | Tragic 14.6% |
| Barbadians | 0.0 /100 | #320 | Tragic 14.6% |
| Cheyenne | 0.0 /100 | #321 | Tragic 14.6% |
| Trinidadians and Tobagonians | 0.0 /100 | #322 | Tragic 14.6% |
| Immigrants | Trinidad and Tobago | 0.0 /100 | #323 | Tragic 14.6% |
| Immigrants | Jamaica | 0.0 /100 | #324 | Tragic 14.8% |
| Alaska Natives | 0.0 /100 | #325 | Tragic 14.9% |
| Immigrants | Barbados | 0.0 /100 | #326 | Tragic 15.2% |
Demographics Similar to Filipinos by Unemployment Among Youth under 25 years
In terms of unemployment among youth under 25 years, the demographic groups most similar to Filipinos are Immigrants from Netherlands (11.1%, a difference of 0.090%), Immigrants from Croatia (11.1%, a difference of 0.10%), South African (11.1%, a difference of 0.18%), Jordanian (11.1%, a difference of 0.22%), and Immigrants from Singapore (11.2%, a difference of 0.28%).
| Demographics | Rating | Rank | Unemployment Among Youth under 25 years |
| Mongolians | 98.9 /100 | #54 | Exceptional 11.1% |
| Irish | 98.9 /100 | #55 | Exceptional 11.1% |
| Immigrants | Saudi Arabia | 98.8 /100 | #56 | Exceptional 11.1% |
| Immigrants | Eritrea | 98.8 /100 | #57 | Exceptional 11.1% |
| Scotch-Irish | 98.8 /100 | #58 | Exceptional 11.1% |
| Immigrants | Eastern Africa | 98.7 /100 | #59 | Exceptional 11.1% |
| South Africans | 98.5 /100 | #60 | Exceptional 11.1% |
| Filipinos | 98.3 /100 | #61 | Exceptional 11.1% |
| Immigrants | Netherlands | 98.1 /100 | #62 | Exceptional 11.1% |
| Immigrants | Croatia | 98.1 /100 | #63 | Exceptional 11.1% |
| Jordanians | 97.9 /100 | #64 | Exceptional 11.1% |
| Immigrants | Singapore | 97.8 /100 | #65 | Exceptional 11.2% |
| Macedonians | 97.7 /100 | #66 | Exceptional 11.2% |
| Chickasaw | 97.7 /100 | #67 | Exceptional 11.2% |
| Immigrants | Kenya | 97.6 /100 | #68 | Exceptional 11.2% |