West Indian vs Northern European Unemployment Among Ages 16 to 19 years
COMPARE
West Indian
Northern European
Unemployment Among Ages 16 to 19 years
Unemployment Among Ages 16 to 19 years Comparison
West Indians
Northern Europeans
22.4%
UNEMPLOYMENT AMONG AGES 16 TO 19 YEARS
0.0/ 100
METRIC RATING
321st/ 347
METRIC RANK
16.6%
UNEMPLOYMENT AMONG AGES 16 TO 19 YEARS
99.0/ 100
METRIC RATING
64th/ 347
METRIC RANK
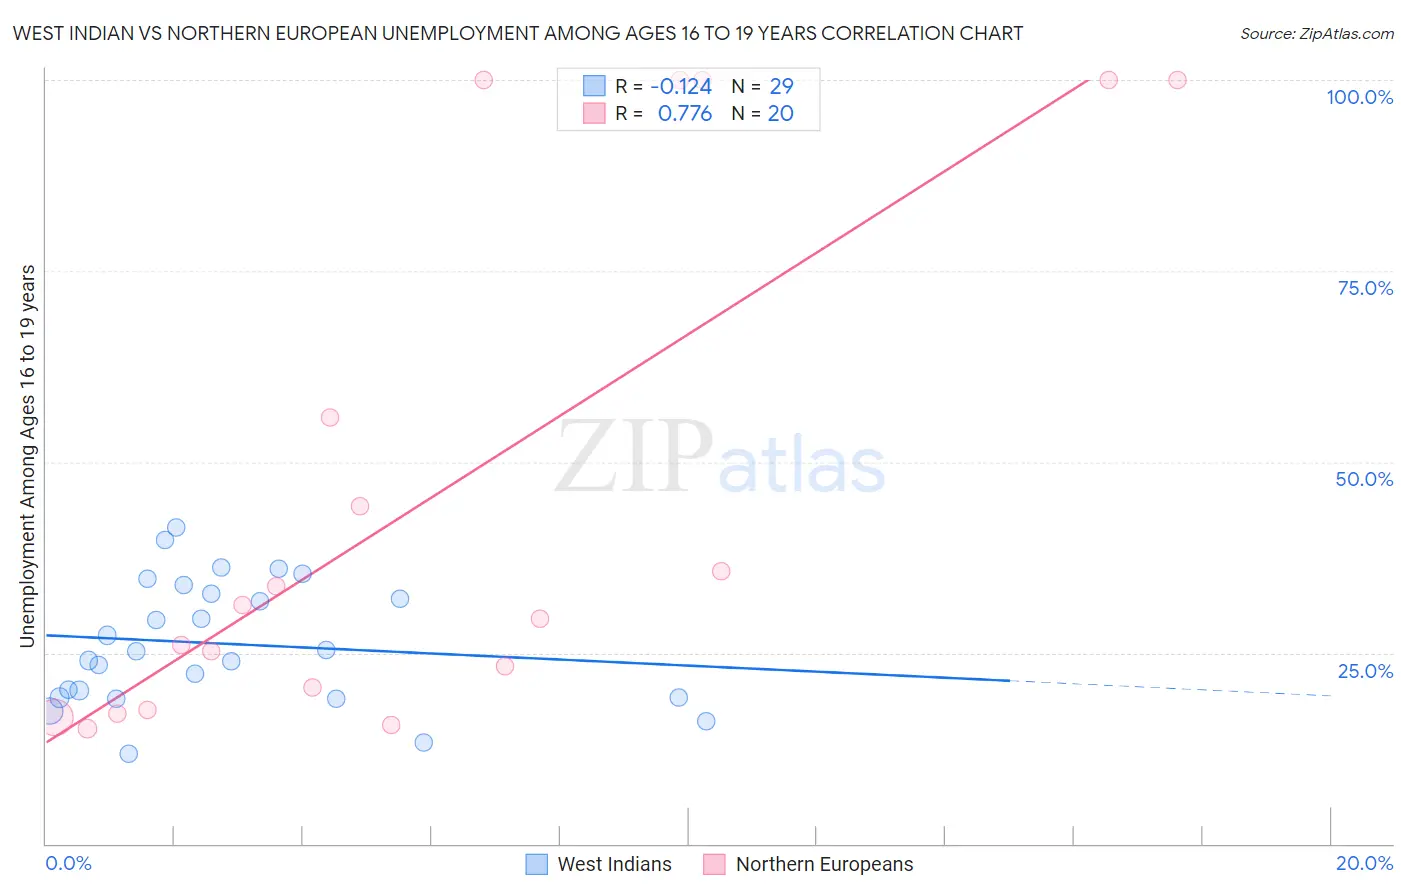
West Indian vs Northern European Unemployment Among Ages 16 to 19 years Correlation Chart
The statistical analysis conducted on geographies consisting of 246,291,481 people shows a poor negative correlation between the proportion of West Indians and unemployment rate among population between the ages 16 and 19 in the United States with a correlation coefficient (R) of -0.124 and weighted average of 22.4%. Similarly, the statistical analysis conducted on geographies consisting of 380,694,439 people shows a strong positive correlation between the proportion of Northern Europeans and unemployment rate among population between the ages 16 and 19 in the United States with a correlation coefficient (R) of 0.776 and weighted average of 16.6%, a difference of 34.9%.
Unemployment Among Ages 16 to 19 years Correlation Summary
| Measurement | West Indian | Northern European |
| Minimum | 11.7% | 15.1% |
| Maximum | 41.3% | 100.0% |
| Range | 29.6% | 84.9% |
| Mean | 26.2% | 45.3% |
| Median | 25.2% | 30.3% |
| Interquartile 25% (IQ1) | 19.1% | 19.0% |
| Interquartile 75% (IQ3) | 33.3% | 77.9% |
| Interquartile Range (IQR) | 14.2% | 58.9% |
| Standard Deviation (Sample) | 8.1% | 33.9% |
| Standard Deviation (Population) | 7.9% | 33.0% |
Similar Demographics by Unemployment Among Ages 16 to 19 years
Demographics Similar to West Indians by Unemployment Among Ages 16 to 19 years
In terms of unemployment among ages 16 to 19 years, the demographic groups most similar to West Indians are Barbadian (22.5%, a difference of 0.14%), Yakama (22.5%, a difference of 0.36%), Cheyenne (22.3%, a difference of 0.70%), Immigrants from Armenia (22.6%, a difference of 0.81%), and Immigrants from West Indies (22.2%, a difference of 0.92%).
| Demographics | Rating | Rank | Unemployment Among Ages 16 to 19 years |
| Alaska Natives | 0.0 /100 | #314 | Tragic 21.8% |
| Immigrants | Dominica | 0.0 /100 | #315 | Tragic 21.9% |
| Tohono O'odham | 0.0 /100 | #316 | Tragic 22.1% |
| Immigrants | Belize | 0.0 /100 | #317 | Tragic 22.2% |
| Immigrants | Jamaica | 0.0 /100 | #318 | Tragic 22.2% |
| Immigrants | West Indies | 0.0 /100 | #319 | Tragic 22.2% |
| Cheyenne | 0.0 /100 | #320 | Tragic 22.3% |
| West Indians | 0.0 /100 | #321 | Tragic 22.4% |
| Barbadians | 0.0 /100 | #322 | Tragic 22.5% |
| Yakama | 0.0 /100 | #323 | Tragic 22.5% |
| Immigrants | Armenia | 0.0 /100 | #324 | Tragic 22.6% |
| Trinidadians and Tobagonians | 0.0 /100 | #325 | Tragic 22.6% |
| Immigrants | Trinidad and Tobago | 0.0 /100 | #326 | Tragic 23.1% |
| Pima | 0.0 /100 | #327 | Tragic 23.1% |
| Immigrants | Dominican Republic | 0.0 /100 | #328 | Tragic 23.3% |
Demographics Similar to Northern Europeans by Unemployment Among Ages 16 to 19 years
In terms of unemployment among ages 16 to 19 years, the demographic groups most similar to Northern Europeans are Scotch-Irish (16.6%, a difference of 0.070%), Immigrants from Japan (16.6%, a difference of 0.10%), Okinawan (16.6%, a difference of 0.13%), Macedonian (16.6%, a difference of 0.25%), and Slavic (16.7%, a difference of 0.30%).
| Demographics | Rating | Rank | Unemployment Among Ages 16 to 19 years |
| Immigrants | Jordan | 99.4 /100 | #57 | Exceptional 16.5% |
| Immigrants | Uganda | 99.4 /100 | #58 | Exceptional 16.5% |
| Irish | 99.4 /100 | #59 | Exceptional 16.5% |
| Menominee | 99.3 /100 | #60 | Exceptional 16.6% |
| Immigrants | Cuba | 99.2 /100 | #61 | Exceptional 16.6% |
| Macedonians | 99.2 /100 | #62 | Exceptional 16.6% |
| Scotch-Irish | 99.1 /100 | #63 | Exceptional 16.6% |
| Northern Europeans | 99.0 /100 | #64 | Exceptional 16.6% |
| Immigrants | Japan | 98.9 /100 | #65 | Exceptional 16.6% |
| Okinawans | 98.9 /100 | #66 | Exceptional 16.6% |
| Slavs | 98.7 /100 | #67 | Exceptional 16.7% |
| Chickasaw | 98.7 /100 | #68 | Exceptional 16.7% |
| Serbians | 98.7 /100 | #69 | Exceptional 16.7% |
| Austrians | 98.6 /100 | #70 | Exceptional 16.7% |
| Latvians | 98.5 /100 | #71 | Exceptional 16.7% |