Immigrants from Mexico vs Immigrants from Latin America Unemployment Among Women with Children Under 6 years
COMPARE
Immigrants from Mexico
Immigrants from Latin America
Unemployment Among Women with Children Under 6 years
Unemployment Among Women with Children Under 6 years Comparison
Immigrants from Mexico
Immigrants from Latin America
9.1%
UNEMPLOYMENT AMONG WOMEN WITH CHILDREN UNDER 6 YEARS
0.0/ 100
METRIC RATING
304th/ 347
METRIC RANK
8.6%
UNEMPLOYMENT AMONG WOMEN WITH CHILDREN UNDER 6 YEARS
0.1/ 100
METRIC RATING
275th/ 347
METRIC RANK
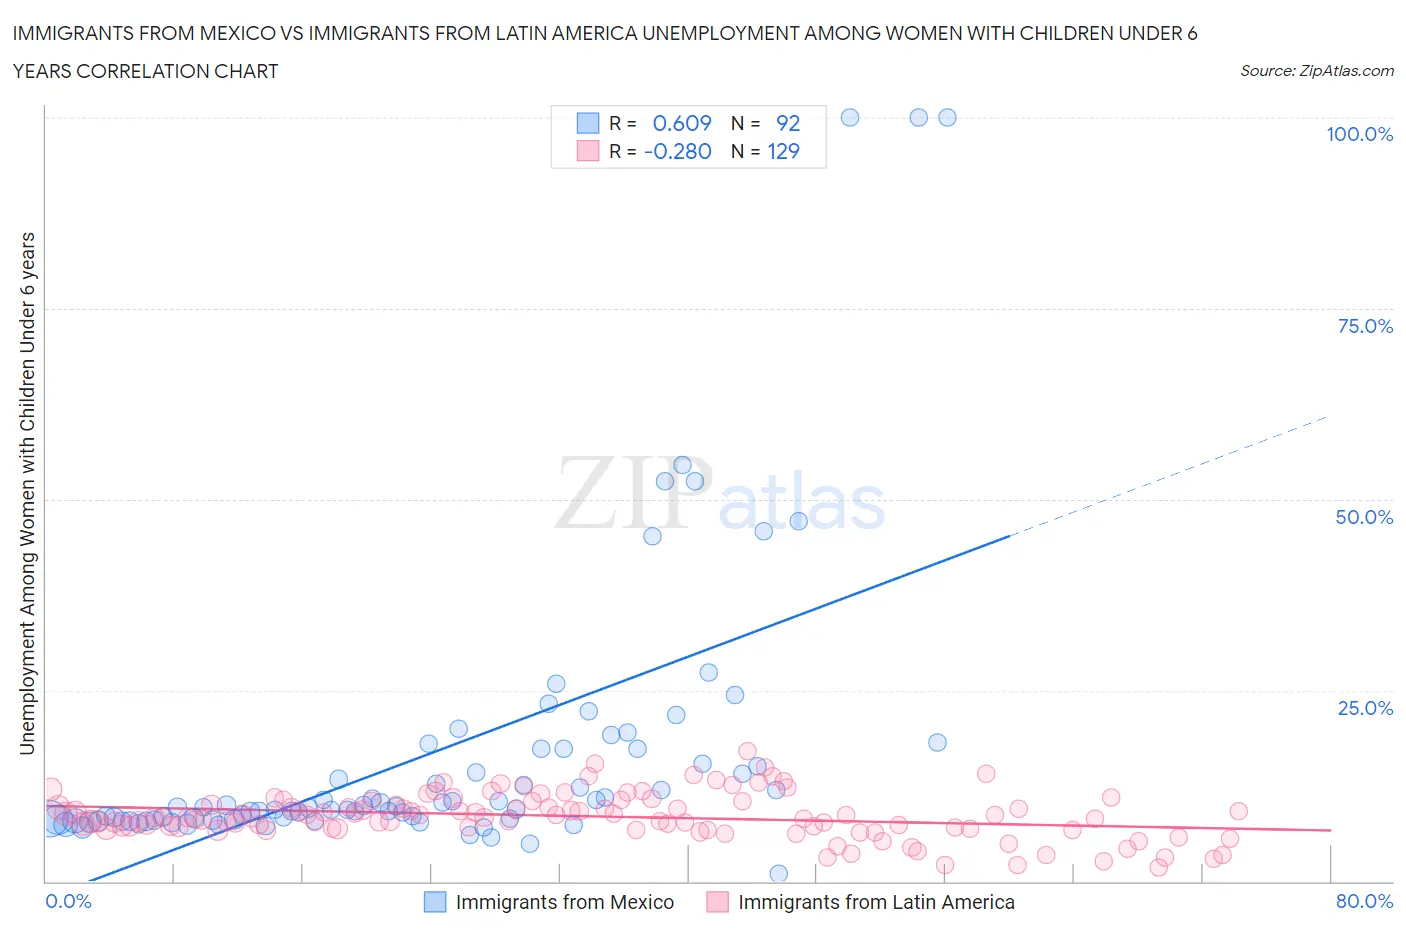
Immigrants from Mexico vs Immigrants from Latin America Unemployment Among Women with Children Under 6 years Correlation Chart
The statistical analysis conducted on geographies consisting of 361,066,070 people shows a significant positive correlation between the proportion of Immigrants from Mexico and unemployment rate among women with children under the age of 6 in the United States with a correlation coefficient (R) of 0.609 and weighted average of 9.1%. Similarly, the statistical analysis conducted on geographies consisting of 377,212,121 people shows a weak negative correlation between the proportion of Immigrants from Latin America and unemployment rate among women with children under the age of 6 in the United States with a correlation coefficient (R) of -0.280 and weighted average of 8.6%, a difference of 5.6%.
Unemployment Among Women with Children Under 6 years Correlation Summary
| Measurement | Immigrants from Mexico | Immigrants from Latin America |
| Minimum | 1.0% | 1.8% |
| Maximum | 100.0% | 17.0% |
| Range | 99.0% | 15.2% |
| Mean | 16.5% | 8.5% |
| Median | 9.6% | 8.3% |
| Interquartile 25% (IQ1) | 8.0% | 6.9% |
| Interquartile 75% (IQ3) | 16.4% | 10.2% |
| Interquartile Range (IQR) | 8.4% | 3.3% |
| Standard Deviation (Sample) | 18.8% | 2.9% |
| Standard Deviation (Population) | 18.7% | 2.9% |
Similar Demographics by Unemployment Among Women with Children Under 6 years
Demographics Similar to Immigrants from Mexico by Unemployment Among Women with Children Under 6 years
In terms of unemployment among women with children under 6 years, the demographic groups most similar to Immigrants from Mexico are Immigrants from West Indies (9.0%, a difference of 0.14%), Hispanic or Latino (9.0%, a difference of 0.17%), Alaskan Athabascan (9.1%, a difference of 0.41%), Pueblo (9.1%, a difference of 0.58%), and Dominican (9.1%, a difference of 0.70%).
| Demographics | Rating | Rank | Unemployment Among Women with Children Under 6 years |
| Mexicans | 0.0 /100 | #297 | Tragic 8.9% |
| Tlingit-Haida | 0.0 /100 | #298 | Tragic 8.9% |
| Immigrants | Jamaica | 0.0 /100 | #299 | Tragic 8.9% |
| Creek | 0.0 /100 | #300 | Tragic 8.9% |
| Chickasaw | 0.0 /100 | #301 | Tragic 9.0% |
| Hispanics or Latinos | 0.0 /100 | #302 | Tragic 9.0% |
| Immigrants | West Indies | 0.0 /100 | #303 | Tragic 9.0% |
| Immigrants | Mexico | 0.0 /100 | #304 | Tragic 9.1% |
| Alaskan Athabascans | 0.0 /100 | #305 | Tragic 9.1% |
| Pueblo | 0.0 /100 | #306 | Tragic 9.1% |
| Dominicans | 0.0 /100 | #307 | Tragic 9.1% |
| Immigrants | Micronesia | 0.0 /100 | #308 | Tragic 9.1% |
| Africans | 0.0 /100 | #309 | Tragic 9.2% |
| Cajuns | 0.0 /100 | #310 | Tragic 9.2% |
| French American Indians | 0.0 /100 | #311 | Tragic 9.2% |
Demographics Similar to Immigrants from Latin America by Unemployment Among Women with Children Under 6 years
In terms of unemployment among women with children under 6 years, the demographic groups most similar to Immigrants from Latin America are Immigrants from Cameroon (8.6%, a difference of 0.050%), Yaqui (8.6%, a difference of 0.34%), Haitian (8.6%, a difference of 0.45%), Slovak (8.5%, a difference of 0.72%), and Immigrants from Dominica (8.6%, a difference of 0.73%).
| Demographics | Rating | Rank | Unemployment Among Women with Children Under 6 years |
| Sub-Saharan Africans | 0.2 /100 | #268 | Tragic 8.4% |
| Immigrants | Haiti | 0.2 /100 | #269 | Tragic 8.4% |
| Immigrants | Senegal | 0.2 /100 | #270 | Tragic 8.5% |
| Immigrants | Congo | 0.2 /100 | #271 | Tragic 8.5% |
| Mexican American Indians | 0.1 /100 | #272 | Tragic 8.5% |
| Slovaks | 0.1 /100 | #273 | Tragic 8.5% |
| Immigrants | Cameroon | 0.1 /100 | #274 | Tragic 8.6% |
| Immigrants | Latin America | 0.1 /100 | #275 | Tragic 8.6% |
| Yaqui | 0.0 /100 | #276 | Tragic 8.6% |
| Haitians | 0.0 /100 | #277 | Tragic 8.6% |
| Immigrants | Dominica | 0.0 /100 | #278 | Tragic 8.6% |
| Immigrants | Guatemala | 0.0 /100 | #279 | Tragic 8.6% |
| Immigrants | Belize | 0.0 /100 | #280 | Tragic 8.6% |
| Guatemalans | 0.0 /100 | #281 | Tragic 8.7% |
| Bermudans | 0.0 /100 | #282 | Tragic 8.7% |