Venezuelan vs Alsatian Unemployment Among Ages 65 to 74 years
COMPARE
Venezuelan
Alsatian
Unemployment Among Ages 65 to 74 years
Unemployment Among Ages 65 to 74 years Comparison
Venezuelans
Alsatians
5.9%
UNEMPLOYMENT AMONG AGES 65 TO 74 YEARS
0.0/ 100
METRIC RATING
311th/ 347
METRIC RANK
5.5%
UNEMPLOYMENT AMONG AGES 65 TO 74 YEARS
5.6/ 100
METRIC RATING
219th/ 347
METRIC RANK
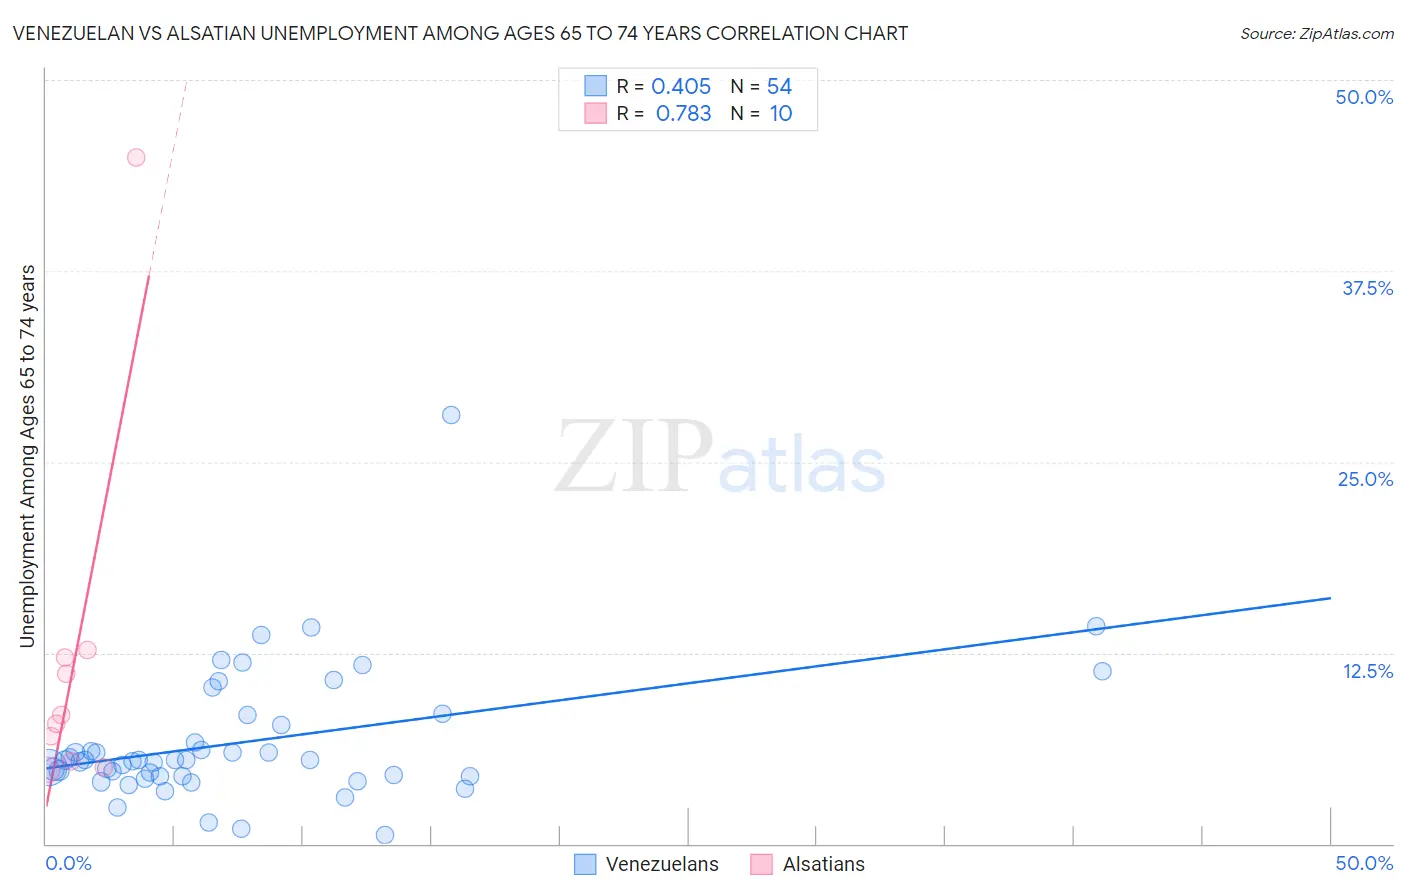
Venezuelan vs Alsatian Unemployment Among Ages 65 to 74 years Correlation Chart
The statistical analysis conducted on geographies consisting of 277,612,730 people shows a moderate positive correlation between the proportion of Venezuelans and unemployment rate among population between the ages 65 and 74 in the United States with a correlation coefficient (R) of 0.405 and weighted average of 5.9%. Similarly, the statistical analysis conducted on geographies consisting of 79,300,647 people shows a strong positive correlation between the proportion of Alsatians and unemployment rate among population between the ages 65 and 74 in the United States with a correlation coefficient (R) of 0.783 and weighted average of 5.5%, a difference of 6.6%.
Unemployment Among Ages 65 to 74 years Correlation Summary
| Measurement | Venezuelan | Alsatian |
| Minimum | 0.60% | 4.8% |
| Maximum | 28.1% | 44.9% |
| Range | 27.5% | 40.1% |
| Mean | 6.6% | 11.9% |
| Median | 5.5% | 8.2% |
| Interquartile 25% (IQ1) | 4.4% | 5.4% |
| Interquartile 75% (IQ3) | 7.7% | 12.2% |
| Interquartile Range (IQR) | 3.3% | 6.8% |
| Standard Deviation (Sample) | 4.4% | 11.9% |
| Standard Deviation (Population) | 4.3% | 11.3% |
Similar Demographics by Unemployment Among Ages 65 to 74 years
Demographics Similar to Venezuelans by Unemployment Among Ages 65 to 74 years
In terms of unemployment among ages 65 to 74 years, the demographic groups most similar to Venezuelans are Hispanic or Latino (5.9%, a difference of 0.020%), Immigrants from Bangladesh (5.9%, a difference of 0.040%), Immigrants from Ecuador (5.8%, a difference of 0.18%), Vietnamese (5.9%, a difference of 0.21%), and Guatemalan (5.8%, a difference of 0.22%).
| Demographics | Rating | Rank | Unemployment Among Ages 65 to 74 years |
| Salvadorans | 0.0 /100 | #304 | Tragic 5.8% |
| Mexicans | 0.0 /100 | #305 | Tragic 5.8% |
| Cheyenne | 0.0 /100 | #306 | Tragic 5.8% |
| British West Indians | 0.0 /100 | #307 | Tragic 5.8% |
| Guatemalans | 0.0 /100 | #308 | Tragic 5.8% |
| Immigrants | Ecuador | 0.0 /100 | #309 | Tragic 5.8% |
| Immigrants | Bangladesh | 0.0 /100 | #310 | Tragic 5.9% |
| Venezuelans | 0.0 /100 | #311 | Tragic 5.9% |
| Hispanics or Latinos | 0.0 /100 | #312 | Tragic 5.9% |
| Vietnamese | 0.0 /100 | #313 | Tragic 5.9% |
| Immigrants | Venezuela | 0.0 /100 | #314 | Tragic 5.9% |
| Immigrants | Guatemala | 0.0 /100 | #315 | Tragic 5.9% |
| Immigrants | El Salvador | 0.0 /100 | #316 | Tragic 5.9% |
| Immigrants | Central America | 0.0 /100 | #317 | Tragic 5.9% |
| Zimbabweans | 0.0 /100 | #318 | Tragic 5.9% |
Demographics Similar to Alsatians by Unemployment Among Ages 65 to 74 years
In terms of unemployment among ages 65 to 74 years, the demographic groups most similar to Alsatians are Samoan (5.5%, a difference of 0.020%), Blackfeet (5.5%, a difference of 0.040%), Immigrants from Syria (5.5%, a difference of 0.080%), Uruguayan (5.5%, a difference of 0.10%), and Spaniard (5.5%, a difference of 0.13%).
| Demographics | Rating | Rank | Unemployment Among Ages 65 to 74 years |
| Haitians | 7.7 /100 | #212 | Tragic 5.5% |
| Italians | 7.7 /100 | #213 | Tragic 5.5% |
| Egyptians | 7.6 /100 | #214 | Tragic 5.5% |
| Americans | 7.3 /100 | #215 | Tragic 5.5% |
| Uruguayans | 6.2 /100 | #216 | Tragic 5.5% |
| Blackfeet | 5.8 /100 | #217 | Tragic 5.5% |
| Samoans | 5.7 /100 | #218 | Tragic 5.5% |
| Alsatians | 5.6 /100 | #219 | Tragic 5.5% |
| Immigrants | Syria | 5.1 /100 | #220 | Tragic 5.5% |
| Spaniards | 4.8 /100 | #221 | Tragic 5.5% |
| Apache | 4.5 /100 | #222 | Tragic 5.5% |
| Hungarians | 4.4 /100 | #223 | Tragic 5.5% |
| Immigrants | Uruguay | 4.2 /100 | #224 | Tragic 5.5% |
| Immigrants | Trinidad and Tobago | 4.1 /100 | #225 | Tragic 5.5% |
| Hondurans | 3.7 /100 | #226 | Tragic 5.5% |