British West Indian vs Puerto Rican Unemployment Among Women with Children Under 6 years
COMPARE
British West Indian
Puerto Rican
Unemployment Among Women with Children Under 6 years
Unemployment Among Women with Children Under 6 years Comparison
British West Indians
Puerto Ricans
8.3%
UNEMPLOYMENT AMONG WOMEN WITH CHILDREN UNDER 6 YEARS
0.5/ 100
METRIC RATING
257th/ 347
METRIC RANK
12.5%
UNEMPLOYMENT AMONG WOMEN WITH CHILDREN UNDER 6 YEARS
0.0/ 100
METRIC RATING
335th/ 347
METRIC RANK
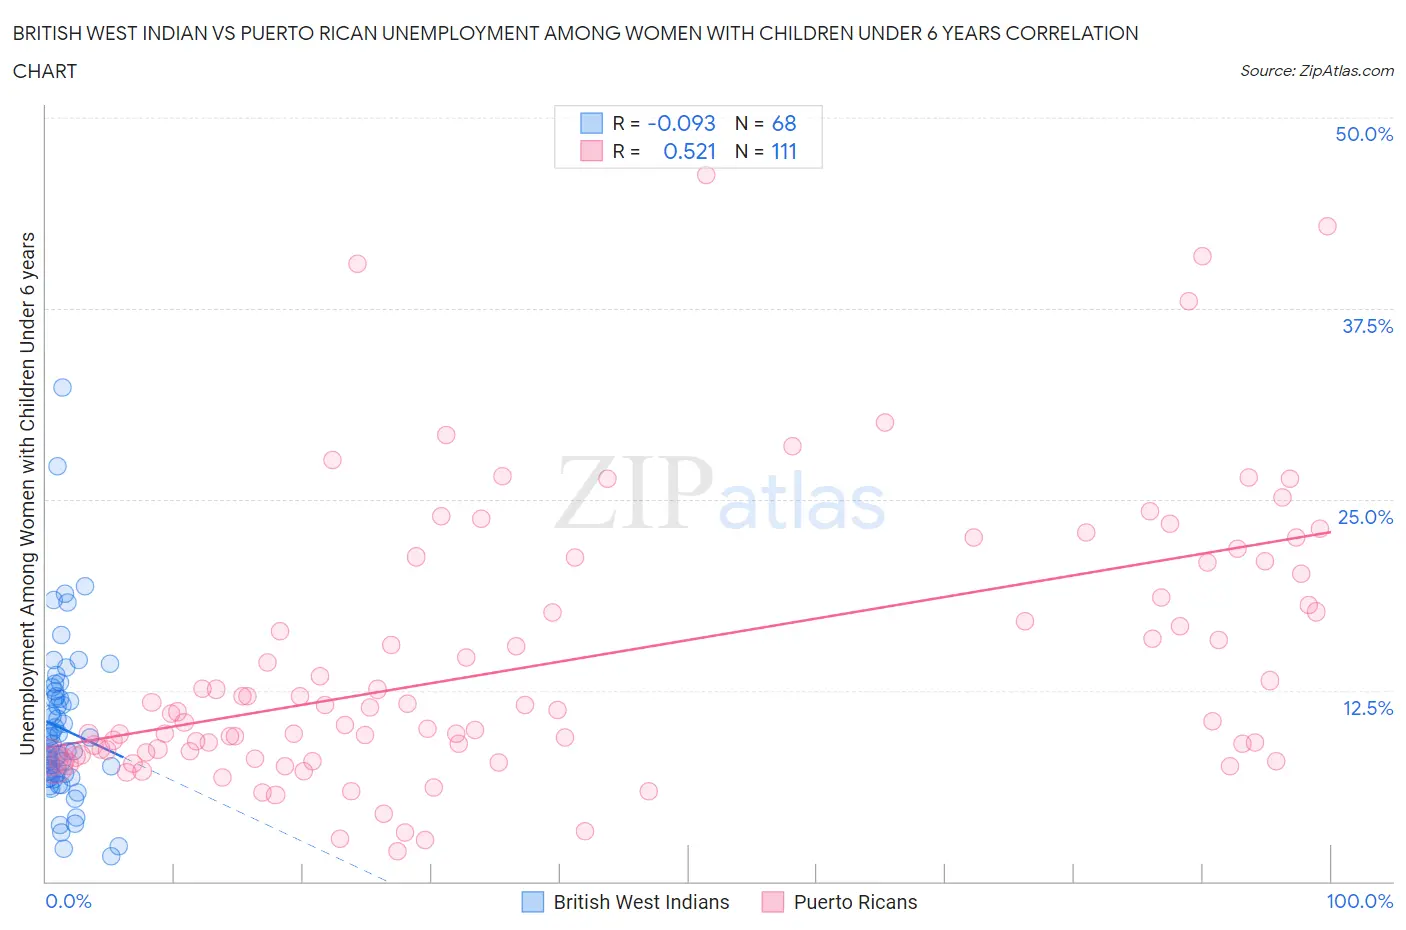
British West Indian vs Puerto Rican Unemployment Among Women with Children Under 6 years Correlation Chart
The statistical analysis conducted on geographies consisting of 134,064,740 people shows a slight negative correlation between the proportion of British West Indians and unemployment rate among women with children under the age of 6 in the United States with a correlation coefficient (R) of -0.093 and weighted average of 8.3%. Similarly, the statistical analysis conducted on geographies consisting of 369,552,119 people shows a substantial positive correlation between the proportion of Puerto Ricans and unemployment rate among women with children under the age of 6 in the United States with a correlation coefficient (R) of 0.521 and weighted average of 12.5%, a difference of 50.8%.
Unemployment Among Women with Children Under 6 years Correlation Summary
| Measurement | British West Indian | Puerto Rican |
| Minimum | 1.6% | 2.0% |
| Maximum | 32.3% | 46.2% |
| Range | 30.7% | 44.2% |
| Mean | 10.0% | 14.4% |
| Median | 8.8% | 11.1% |
| Interquartile 25% (IQ1) | 7.0% | 8.3% |
| Interquartile 75% (IQ3) | 12.1% | 20.1% |
| Interquartile Range (IQR) | 5.1% | 11.9% |
| Standard Deviation (Sample) | 5.3% | 9.0% |
| Standard Deviation (Population) | 5.2% | 9.0% |
Similar Demographics by Unemployment Among Women with Children Under 6 years
Demographics Similar to British West Indians by Unemployment Among Women with Children Under 6 years
In terms of unemployment among women with children under 6 years, the demographic groups most similar to British West Indians are Immigrants from Ghana (8.3%, a difference of 0.020%), Celtic (8.3%, a difference of 0.26%), Immigrants from Portugal (8.3%, a difference of 0.27%), Barbadian (8.3%, a difference of 0.31%), and Immigrants from Caribbean (8.3%, a difference of 0.57%).
| Demographics | Rating | Rank | Unemployment Among Women with Children Under 6 years |
| Nigerians | 1.1 /100 | #250 | Tragic 8.2% |
| Guyanese | 1.0 /100 | #251 | Tragic 8.2% |
| Ghanaians | 1.0 /100 | #252 | Tragic 8.2% |
| Immigrants | Guyana | 0.8 /100 | #253 | Tragic 8.2% |
| Immigrants | Caribbean | 0.7 /100 | #254 | Tragic 8.3% |
| Immigrants | Portugal | 0.6 /100 | #255 | Tragic 8.3% |
| Celtics | 0.6 /100 | #256 | Tragic 8.3% |
| British West Indians | 0.5 /100 | #257 | Tragic 8.3% |
| Immigrants | Ghana | 0.5 /100 | #258 | Tragic 8.3% |
| Barbadians | 0.4 /100 | #259 | Tragic 8.3% |
| Whites/Caucasians | 0.3 /100 | #260 | Tragic 8.4% |
| Immigrants | Liberia | 0.3 /100 | #261 | Tragic 8.4% |
| West Indians | 0.3 /100 | #262 | Tragic 8.4% |
| Scotch-Irish | 0.3 /100 | #263 | Tragic 8.4% |
| Hondurans | 0.3 /100 | #264 | Tragic 8.4% |
Demographics Similar to Puerto Ricans by Unemployment Among Women with Children Under 6 years
In terms of unemployment among women with children under 6 years, the demographic groups most similar to Puerto Ricans are Apache (12.3%, a difference of 1.8%), Shoshone (13.2%, a difference of 5.1%), Chippewa (13.3%, a difference of 6.3%), Pima (13.4%, a difference of 7.1%), and Navajo (13.5%, a difference of 7.5%).
| Demographics | Rating | Rank | Unemployment Among Women with Children Under 6 years |
| Tohono O'odham | 0.0 /100 | #328 | Tragic 10.2% |
| Blacks/African Americans | 0.0 /100 | #329 | Tragic 10.3% |
| Pennsylvania Germans | 0.0 /100 | #330 | Tragic 10.8% |
| Colville | 0.0 /100 | #331 | Tragic 11.2% |
| Sioux | 0.0 /100 | #332 | Tragic 11.5% |
| Natives/Alaskans | 0.0 /100 | #333 | Tragic 11.5% |
| Apache | 0.0 /100 | #334 | Tragic 12.3% |
| Puerto Ricans | 0.0 /100 | #335 | Tragic 12.5% |
| Shoshone | 0.0 /100 | #336 | Tragic 13.2% |
| Chippewa | 0.0 /100 | #337 | Tragic 13.3% |
| Pima | 0.0 /100 | #338 | Tragic 13.4% |
| Navajo | 0.0 /100 | #339 | Tragic 13.5% |
| Immigrants | Yemen | 0.0 /100 | #340 | Tragic 13.5% |
| Lumbee | 0.0 /100 | #341 | Tragic 13.8% |
| Yuman | 0.0 /100 | #342 | Tragic 14.6% |