Venezuelan vs Immigrants from France Unemployment
COMPARE
Venezuelan
Immigrants from France
Unemployment
Unemployment Comparison
Venezuelans
Immigrants from France
4.7%
UNEMPLOYMENT
99.9/ 100
METRIC RATING
24th/ 347
METRIC RANK
5.1%
UNEMPLOYMENT
89.7/ 100
METRIC RATING
119th/ 347
METRIC RANK
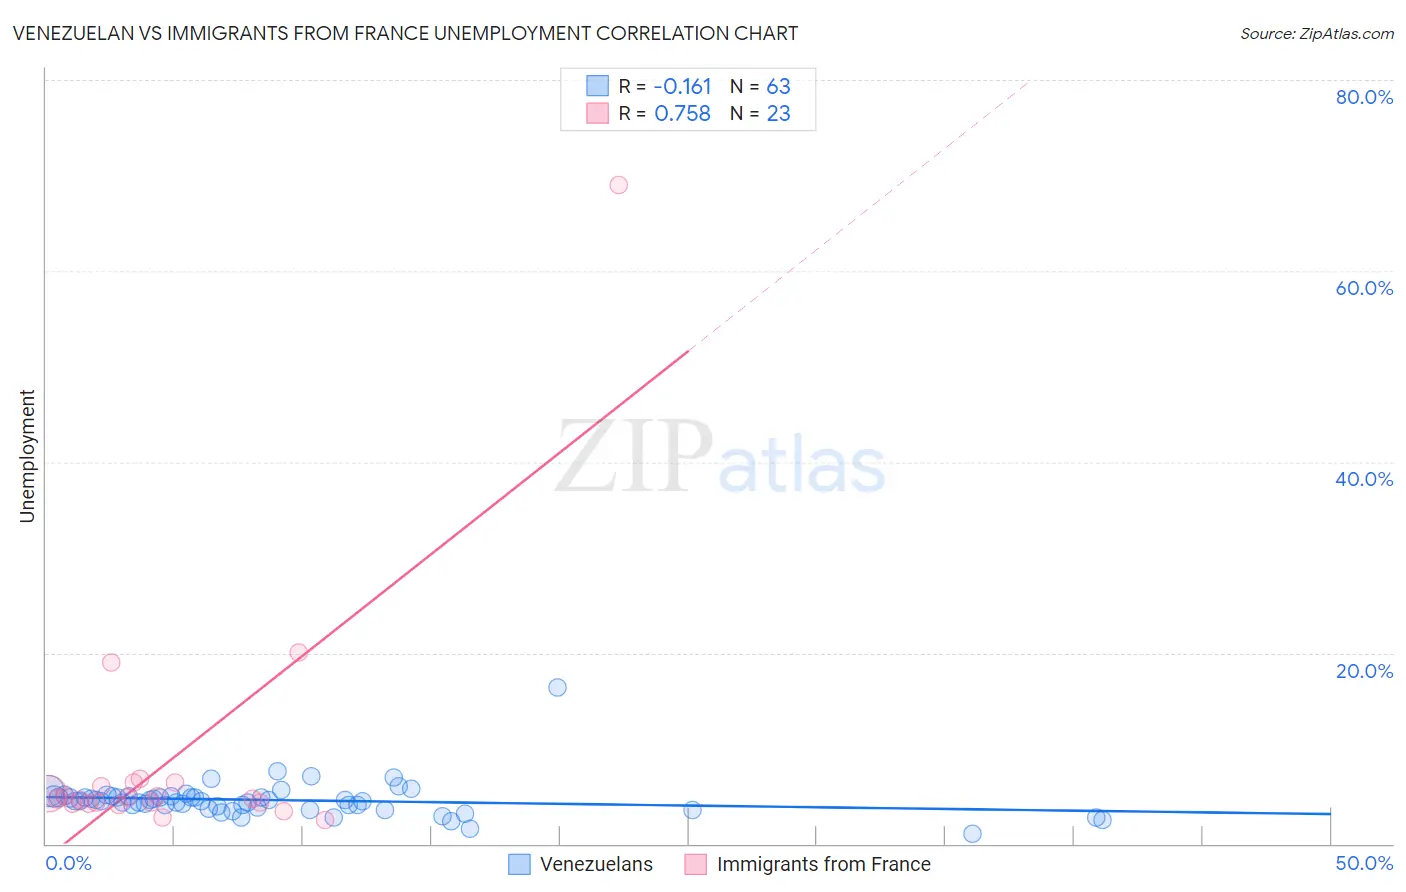
Venezuelan vs Immigrants from France Unemployment Correlation Chart
The statistical analysis conducted on geographies consisting of 306,194,859 people shows a poor negative correlation between the proportion of Venezuelans and unemployment in the United States with a correlation coefficient (R) of -0.161 and weighted average of 4.7%. Similarly, the statistical analysis conducted on geographies consisting of 287,750,590 people shows a strong positive correlation between the proportion of Immigrants from France and unemployment in the United States with a correlation coefficient (R) of 0.758 and weighted average of 5.1%, a difference of 8.0%.
Unemployment Correlation Summary
| Measurement | Venezuelan | Immigrants from France |
| Minimum | 1.1% | 2.5% |
| Maximum | 16.4% | 69.0% |
| Range | 15.3% | 66.5% |
| Mean | 4.6% | 8.8% |
| Median | 4.5% | 4.7% |
| Interquartile 25% (IQ1) | 3.8% | 4.2% |
| Interquartile 75% (IQ3) | 4.9% | 6.4% |
| Interquartile Range (IQR) | 1.1% | 2.2% |
| Standard Deviation (Sample) | 1.9% | 13.8% |
| Standard Deviation (Population) | 1.9% | 13.5% |
Similar Demographics by Unemployment
Demographics Similar to Venezuelans by Unemployment
In terms of unemployment, the demographic groups most similar to Venezuelans are Latvian (4.7%, a difference of 0.070%), British (4.7%, a difference of 0.080%), Bulgarian (4.7%, a difference of 0.11%), Finnish (4.7%, a difference of 0.32%), and Welsh (4.7%, a difference of 0.38%).
| Demographics | Rating | Rank | Unemployment |
| Slovenes | 99.9 /100 | #17 | Exceptional 4.7% |
| Immigrants | Venezuela | 99.9 /100 | #18 | Exceptional 4.7% |
| Scottish | 99.9 /100 | #19 | Exceptional 4.7% |
| Carpatho Rusyns | 99.9 /100 | #20 | Exceptional 4.7% |
| Welsh | 99.9 /100 | #21 | Exceptional 4.7% |
| Thais | 99.9 /100 | #22 | Exceptional 4.7% |
| British | 99.9 /100 | #23 | Exceptional 4.7% |
| Venezuelans | 99.9 /100 | #24 | Exceptional 4.7% |
| Latvians | 99.9 /100 | #25 | Exceptional 4.7% |
| Bulgarians | 99.9 /100 | #26 | Exceptional 4.7% |
| Finns | 99.9 /100 | #27 | Exceptional 4.7% |
| Cubans | 99.8 /100 | #28 | Exceptional 4.7% |
| Poles | 99.8 /100 | #29 | Exceptional 4.7% |
| Irish | 99.8 /100 | #30 | Exceptional 4.8% |
| Croatians | 99.8 /100 | #31 | Exceptional 4.8% |
Demographics Similar to Immigrants from France by Unemployment
In terms of unemployment, the demographic groups most similar to Immigrants from France are Macedonian (5.1%, a difference of 0.010%), Lebanese (5.1%, a difference of 0.080%), Immigrants from Switzerland (5.1%, a difference of 0.090%), Asian (5.1%, a difference of 0.12%), and Ethiopian (5.1%, a difference of 0.17%).
| Demographics | Rating | Rank | Unemployment |
| South Africans | 92.6 /100 | #112 | Exceptional 5.1% |
| Argentineans | 92.4 /100 | #113 | Exceptional 5.1% |
| Immigrants | Ireland | 92.1 /100 | #114 | Exceptional 5.1% |
| Immigrants | Western Europe | 91.1 /100 | #115 | Exceptional 5.1% |
| Immigrants | Sri Lanka | 91.1 /100 | #116 | Exceptional 5.1% |
| Immigrants | Malaysia | 91.0 /100 | #117 | Exceptional 5.1% |
| Immigrants | Germany | 90.8 /100 | #118 | Exceptional 5.1% |
| Immigrants | France | 89.7 /100 | #119 | Excellent 5.1% |
| Macedonians | 89.7 /100 | #120 | Excellent 5.1% |
| Lebanese | 89.2 /100 | #121 | Excellent 5.1% |
| Immigrants | Switzerland | 89.1 /100 | #122 | Excellent 5.1% |
| Asians | 89.0 /100 | #123 | Excellent 5.1% |
| Ethiopians | 88.6 /100 | #124 | Excellent 5.1% |
| Immigrants | Eastern Asia | 88.3 /100 | #125 | Excellent 5.1% |
| Kenyans | 88.2 /100 | #126 | Excellent 5.1% |