Sierra Leonean vs Brazilian Unemployment Among Ages 45 to 54 years
COMPARE
Sierra Leonean
Brazilian
Unemployment Among Ages 45 to 54 years
Unemployment Among Ages 45 to 54 years Comparison
Sierra Leoneans
Brazilians
4.5%
UNEMPLOYMENT AMONG AGES 45 TO 54 YEARS
46.7/ 100
METRIC RATING
183rd/ 347
METRIC RANK
4.6%
UNEMPLOYMENT AMONG AGES 45 TO 54 YEARS
20.1/ 100
METRIC RATING
199th/ 347
METRIC RANK
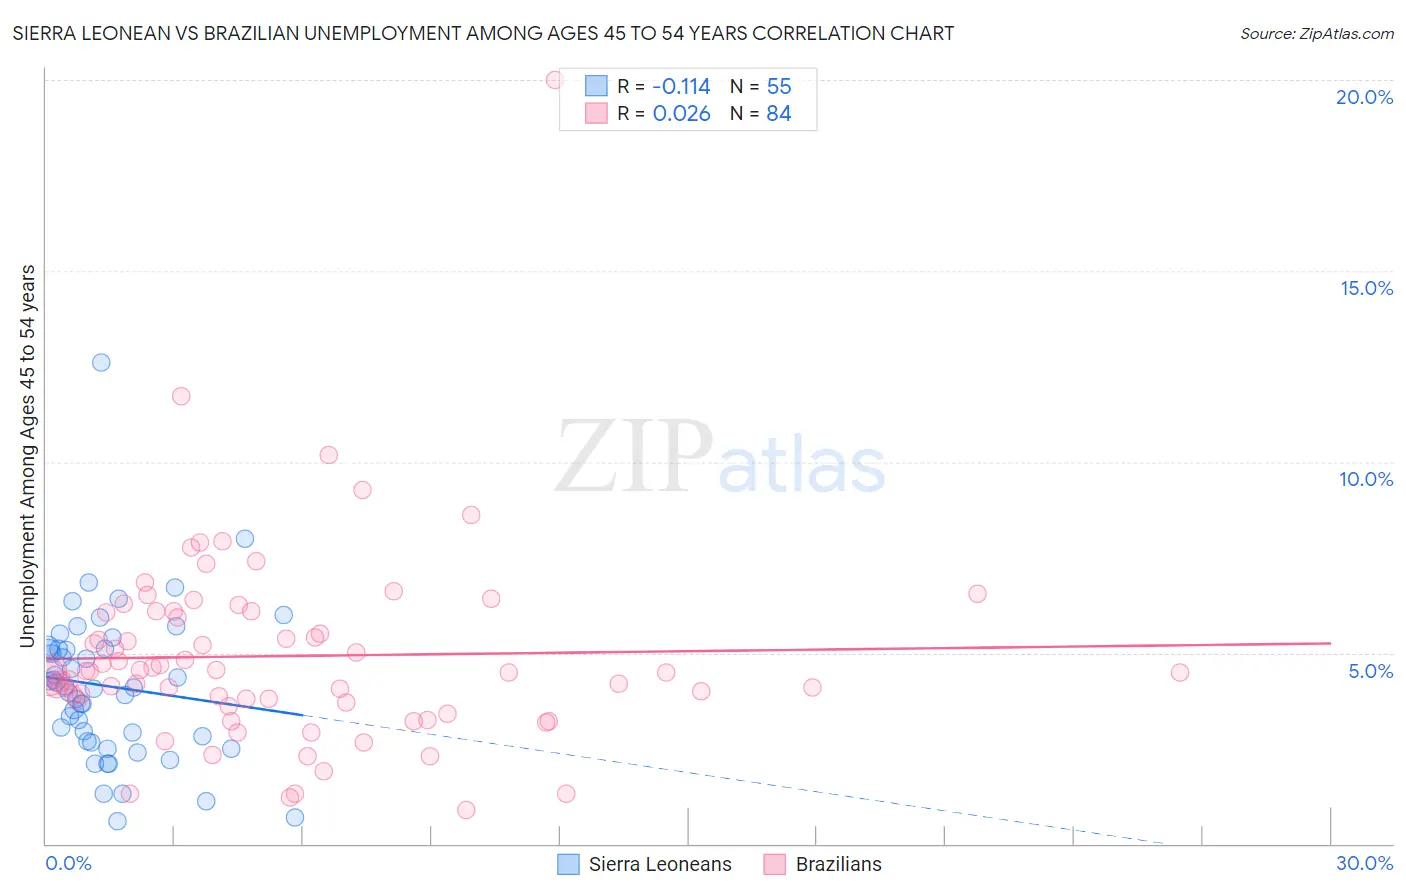
Sierra Leonean vs Brazilian Unemployment Among Ages 45 to 54 years Correlation Chart
The statistical analysis conducted on geographies consisting of 82,825,579 people shows a poor negative correlation between the proportion of Sierra Leoneans and unemployment rate among population between the ages 45 and 54 in the United States with a correlation coefficient (R) of -0.114 and weighted average of 4.5%. Similarly, the statistical analysis conducted on geographies consisting of 318,130,578 people shows no correlation between the proportion of Brazilians and unemployment rate among population between the ages 45 and 54 in the United States with a correlation coefficient (R) of 0.026 and weighted average of 4.6%, a difference of 1.5%.
Unemployment Among Ages 45 to 54 years Correlation Summary
| Measurement | Sierra Leonean | Brazilian |
| Minimum | 0.60% | 0.90% |
| Maximum | 12.6% | 20.0% |
| Range | 12.0% | 19.1% |
| Mean | 4.1% | 4.9% |
| Median | 4.1% | 4.5% |
| Interquartile 25% (IQ1) | 2.7% | 3.7% |
| Interquartile 75% (IQ3) | 5.1% | 6.1% |
| Interquartile Range (IQR) | 2.4% | 2.3% |
| Standard Deviation (Sample) | 2.0% | 2.6% |
| Standard Deviation (Population) | 2.0% | 2.6% |
Demographics Similar to Sierra Leoneans and Brazilians by Unemployment Among Ages 45 to 54 years
In terms of unemployment among ages 45 to 54 years, the demographic groups most similar to Sierra Leoneans are Immigrants from China (4.5%, a difference of 0.0%), Immigrants from Poland (4.5%, a difference of 0.010%), Immigrants from Hong Kong (4.5%, a difference of 0.040%), Immigrants from Philippines (4.5%, a difference of 0.27%), and Hawaiian (4.5%, a difference of 0.36%). Similarly, the demographic groups most similar to Brazilians are Immigrants from Denmark (4.6%, a difference of 0.020%), Immigrants from Costa Rica (4.6%, a difference of 0.030%), Immigrants from Belarus (4.6%, a difference of 0.65%), Estonian (4.6%, a difference of 0.68%), and Albanian (4.6%, a difference of 0.68%).
| Demographics | Rating | Rank | Unemployment Among Ages 45 to 54 years |
| Immigrants | Poland | 47.0 /100 | #181 | Average 4.5% |
| Immigrants | China | 46.7 /100 | #182 | Average 4.5% |
| Sierra Leoneans | 46.7 /100 | #183 | Average 4.5% |
| Immigrants | Hong Kong | 45.9 /100 | #184 | Average 4.5% |
| Immigrants | Philippines | 41.0 /100 | #185 | Average 4.5% |
| Hawaiians | 39.1 /100 | #186 | Fair 4.5% |
| Immigrants | Ukraine | 36.8 /100 | #187 | Fair 4.5% |
| Immigrants | Sierra Leone | 36.3 /100 | #188 | Fair 4.6% |
| Immigrants | Laos | 35.7 /100 | #189 | Fair 4.6% |
| Immigrants | Serbia | 34.8 /100 | #190 | Fair 4.6% |
| Immigrants | Uruguay | 34.4 /100 | #191 | Fair 4.6% |
| Immigrants | Thailand | 34.1 /100 | #192 | Fair 4.6% |
| Immigrants | Lithuania | 33.2 /100 | #193 | Fair 4.6% |
| South Americans | 32.9 /100 | #194 | Fair 4.6% |
| Peruvians | 31.5 /100 | #195 | Fair 4.6% |
| Estonians | 31.2 /100 | #196 | Fair 4.6% |
| Albanians | 31.1 /100 | #197 | Fair 4.6% |
| Immigrants | Belarus | 30.6 /100 | #198 | Fair 4.6% |
| Brazilians | 20.1 /100 | #199 | Fair 4.6% |
| Immigrants | Denmark | 19.8 /100 | #200 | Poor 4.6% |
| Immigrants | Costa Rica | 19.7 /100 | #201 | Poor 4.6% |