Haitian vs Brazilian Unemployment Among Ages 45 to 54 years
COMPARE
Haitian
Brazilian
Unemployment Among Ages 45 to 54 years
Unemployment Among Ages 45 to 54 years Comparison
Haitians
Brazilians
5.2%
UNEMPLOYMENT AMONG AGES 45 TO 54 YEARS
0.0/ 100
METRIC RATING
287th/ 347
METRIC RANK
4.6%
UNEMPLOYMENT AMONG AGES 45 TO 54 YEARS
20.1/ 100
METRIC RATING
199th/ 347
METRIC RANK
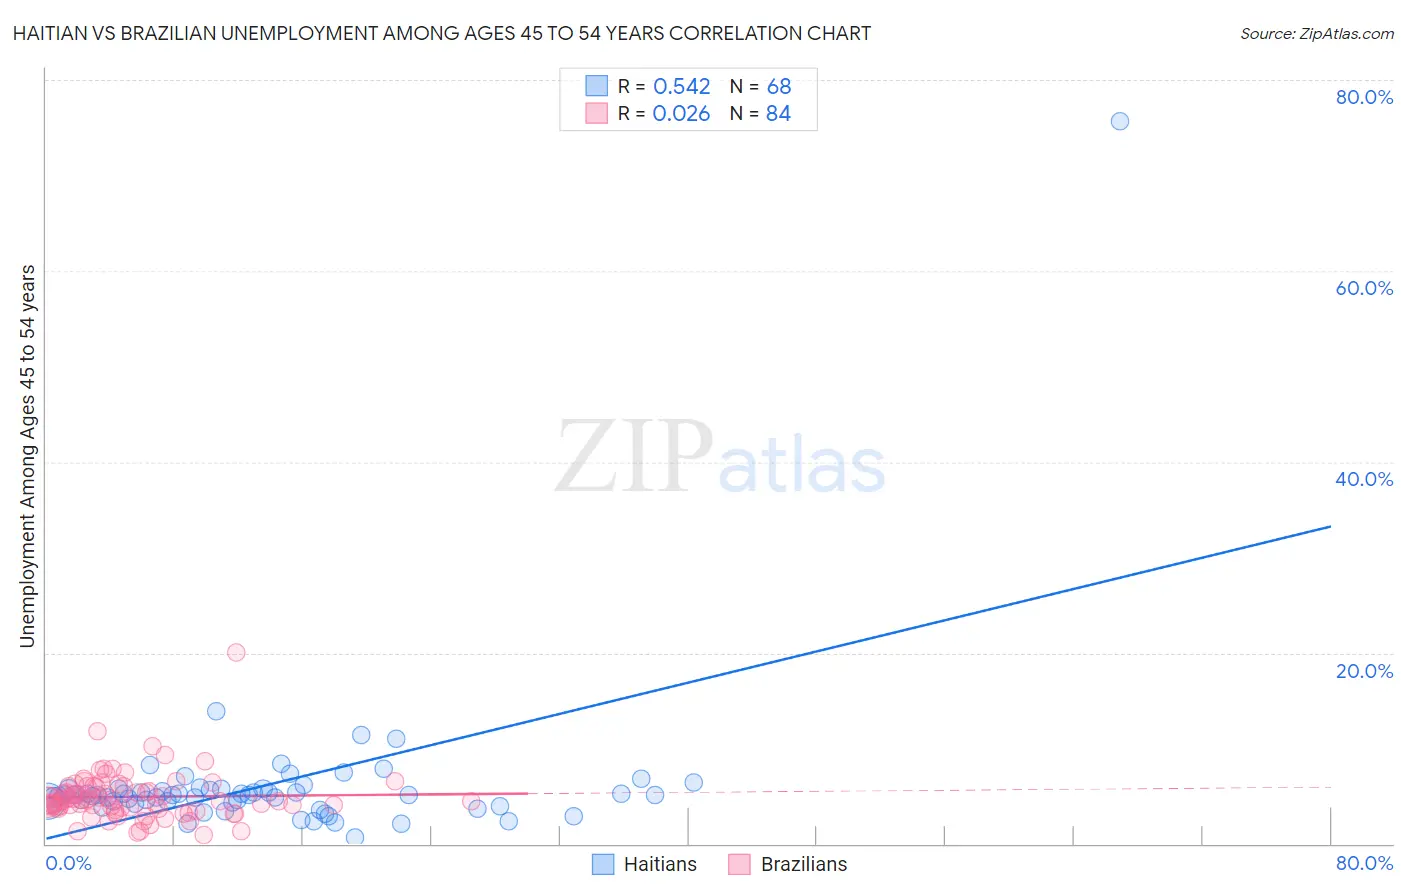
Haitian vs Brazilian Unemployment Among Ages 45 to 54 years Correlation Chart
The statistical analysis conducted on geographies consisting of 282,569,188 people shows a substantial positive correlation between the proportion of Haitians and unemployment rate among population between the ages 45 and 54 in the United States with a correlation coefficient (R) of 0.542 and weighted average of 5.2%. Similarly, the statistical analysis conducted on geographies consisting of 318,130,578 people shows no correlation between the proportion of Brazilians and unemployment rate among population between the ages 45 and 54 in the United States with a correlation coefficient (R) of 0.026 and weighted average of 4.6%, a difference of 12.5%.
Unemployment Among Ages 45 to 54 years Correlation Summary
| Measurement | Haitian | Brazilian |
| Minimum | 0.70% | 0.90% |
| Maximum | 75.7% | 20.0% |
| Range | 75.0% | 19.1% |
| Mean | 6.2% | 4.9% |
| Median | 5.1% | 4.5% |
| Interquartile 25% (IQ1) | 4.3% | 3.7% |
| Interquartile 75% (IQ3) | 5.7% | 6.1% |
| Interquartile Range (IQR) | 1.4% | 2.3% |
| Standard Deviation (Sample) | 8.8% | 2.6% |
| Standard Deviation (Population) | 8.7% | 2.6% |
Similar Demographics by Unemployment Among Ages 45 to 54 years
Demographics Similar to Haitians by Unemployment Among Ages 45 to 54 years
In terms of unemployment among ages 45 to 54 years, the demographic groups most similar to Haitians are Immigrants from Caribbean (5.2%, a difference of 0.080%), Immigrants from Haiti (5.2%, a difference of 0.47%), Immigrants from Portugal (5.2%, a difference of 0.64%), Armenian (5.2%, a difference of 0.64%), and Senegalese (5.1%, a difference of 0.83%).
| Demographics | Rating | Rank | Unemployment Among Ages 45 to 54 years |
| Blackfeet | 0.0 /100 | #280 | Tragic 5.1% |
| Spanish American Indians | 0.0 /100 | #281 | Tragic 5.1% |
| Africans | 0.0 /100 | #282 | Tragic 5.1% |
| Hispanics or Latinos | 0.0 /100 | #283 | Tragic 5.1% |
| Kiowa | 0.0 /100 | #284 | Tragic 5.1% |
| Iroquois | 0.0 /100 | #285 | Tragic 5.1% |
| Senegalese | 0.0 /100 | #286 | Tragic 5.1% |
| Haitians | 0.0 /100 | #287 | Tragic 5.2% |
| Immigrants | Caribbean | 0.0 /100 | #288 | Tragic 5.2% |
| Immigrants | Haiti | 0.0 /100 | #289 | Tragic 5.2% |
| Immigrants | Portugal | 0.0 /100 | #290 | Tragic 5.2% |
| Armenians | 0.0 /100 | #291 | Tragic 5.2% |
| Trinidadians and Tobagonians | 0.0 /100 | #292 | Tragic 5.2% |
| Immigrants | Senegal | 0.0 /100 | #293 | Tragic 5.2% |
| Belizeans | 0.0 /100 | #294 | Tragic 5.2% |
Demographics Similar to Brazilians by Unemployment Among Ages 45 to 54 years
In terms of unemployment among ages 45 to 54 years, the demographic groups most similar to Brazilians are Immigrants from Denmark (4.6%, a difference of 0.020%), Immigrants from Costa Rica (4.6%, a difference of 0.030%), Immigrants from Peru (4.6%, a difference of 0.070%), Liberian (4.6%, a difference of 0.10%), and Immigrants from Morocco (4.6%, a difference of 0.25%).
| Demographics | Rating | Rank | Unemployment Among Ages 45 to 54 years |
| Immigrants | Thailand | 34.1 /100 | #192 | Fair 4.6% |
| Immigrants | Lithuania | 33.2 /100 | #193 | Fair 4.6% |
| South Americans | 32.9 /100 | #194 | Fair 4.6% |
| Peruvians | 31.5 /100 | #195 | Fair 4.6% |
| Estonians | 31.2 /100 | #196 | Fair 4.6% |
| Albanians | 31.1 /100 | #197 | Fair 4.6% |
| Immigrants | Belarus | 30.6 /100 | #198 | Fair 4.6% |
| Brazilians | 20.1 /100 | #199 | Fair 4.6% |
| Immigrants | Denmark | 19.8 /100 | #200 | Poor 4.6% |
| Immigrants | Costa Rica | 19.7 /100 | #201 | Poor 4.6% |
| Immigrants | Peru | 19.1 /100 | #202 | Poor 4.6% |
| Liberians | 18.7 /100 | #203 | Poor 4.6% |
| Immigrants | Morocco | 16.8 /100 | #204 | Poor 4.6% |
| Immigrants | Greece | 16.2 /100 | #205 | Poor 4.6% |
| Immigrants | Switzerland | 14.0 /100 | #206 | Poor 4.6% |