Immigrants from Eritrea vs Immigrants from West Indies Unemployment Among Women with Children Under 6 years
COMPARE
Immigrants from Eritrea
Immigrants from West Indies
Unemployment Among Women with Children Under 6 years
Unemployment Among Women with Children Under 6 years Comparison
Immigrants from Eritrea
Immigrants from West Indies
7.0%
UNEMPLOYMENT AMONG WOMEN WITH CHILDREN UNDER 6 YEARS
99.4/ 100
METRIC RATING
69th/ 347
METRIC RANK
9.0%
UNEMPLOYMENT AMONG WOMEN WITH CHILDREN UNDER 6 YEARS
0.0/ 100
METRIC RATING
303rd/ 347
METRIC RANK
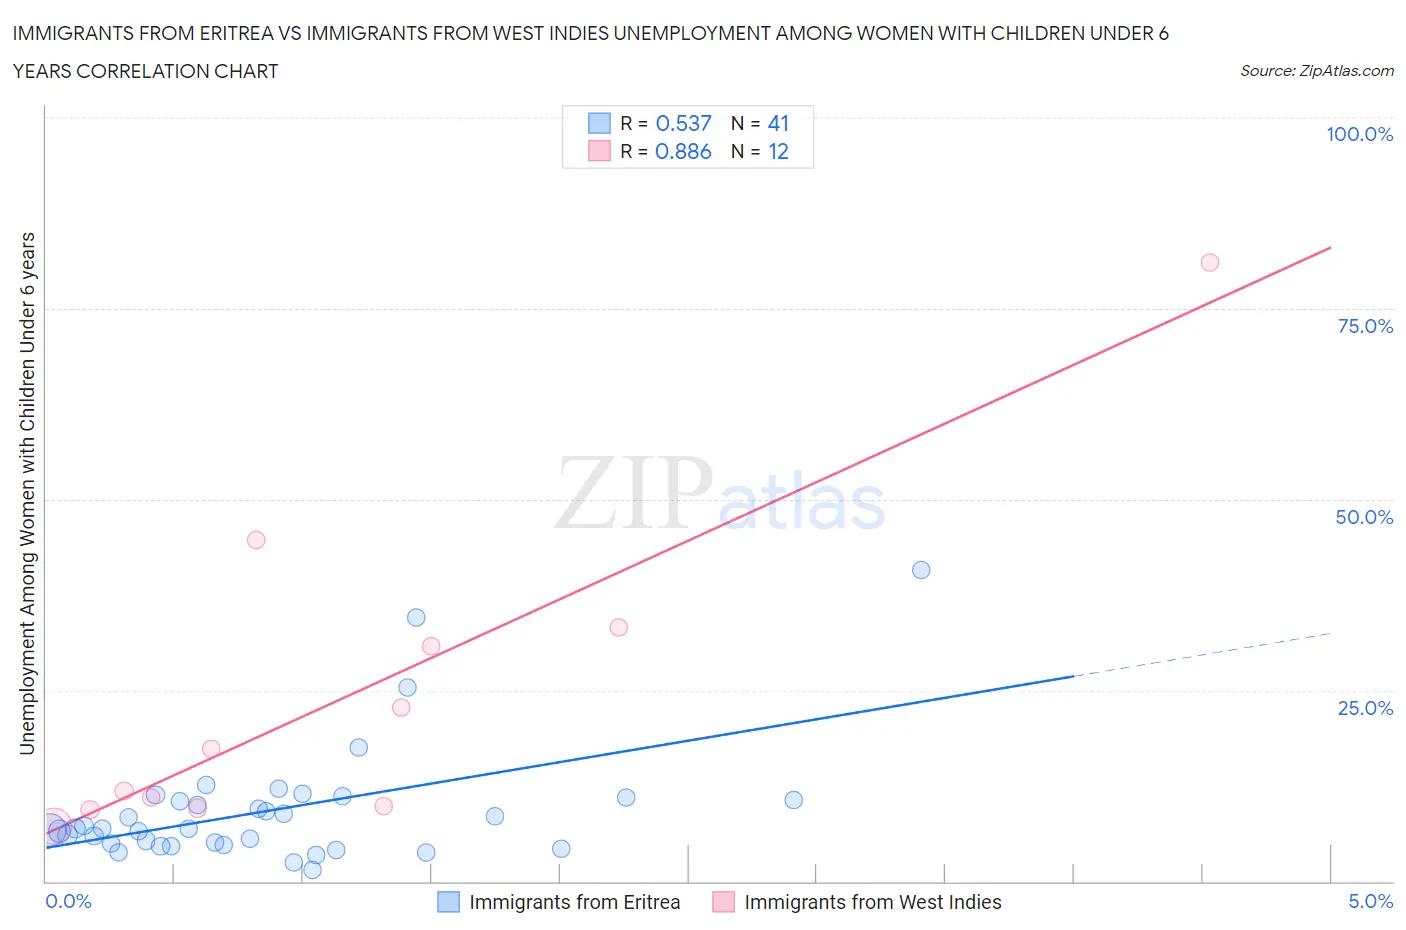
Immigrants from Eritrea vs Immigrants from West Indies Unemployment Among Women with Children Under 6 years Correlation Chart
The statistical analysis conducted on geographies consisting of 96,202,979 people shows a substantial positive correlation between the proportion of Immigrants from Eritrea and unemployment rate among women with children under the age of 6 in the United States with a correlation coefficient (R) of 0.537 and weighted average of 7.0%. Similarly, the statistical analysis conducted on geographies consisting of 68,002,118 people shows a very strong positive correlation between the proportion of Immigrants from West Indies and unemployment rate among women with children under the age of 6 in the United States with a correlation coefficient (R) of 0.886 and weighted average of 9.0%, a difference of 29.4%.
Unemployment Among Women with Children Under 6 years Correlation Summary
| Measurement | Immigrants from Eritrea | Immigrants from West Indies |
| Minimum | 1.4% | 7.2% |
| Maximum | 40.8% | 81.0% |
| Range | 39.4% | 73.8% |
| Mean | 9.3% | 24.0% |
| Median | 6.9% | 14.6% |
| Interquartile 25% (IQ1) | 4.9% | 9.7% |
| Interquartile 75% (IQ3) | 10.9% | 32.0% |
| Interquartile Range (IQR) | 6.0% | 22.3% |
| Standard Deviation (Sample) | 7.8% | 21.5% |
| Standard Deviation (Population) | 7.7% | 20.6% |
Similar Demographics by Unemployment Among Women with Children Under 6 years
Demographics Similar to Immigrants from Eritrea by Unemployment Among Women with Children Under 6 years
In terms of unemployment among women with children under 6 years, the demographic groups most similar to Immigrants from Eritrea are Immigrants from Iraq (7.0%, a difference of 0.010%), Paraguayan (7.0%, a difference of 0.030%), Afghan (7.0%, a difference of 0.040%), Cuban (7.0%, a difference of 0.14%), and Immigrants from Netherlands (7.0%, a difference of 0.26%).
| Demographics | Rating | Rank | Unemployment Among Women with Children Under 6 years |
| Somalis | 99.7 /100 | #62 | Exceptional 6.9% |
| Maltese | 99.7 /100 | #63 | Exceptional 6.9% |
| Tongans | 99.7 /100 | #64 | Exceptional 6.9% |
| Immigrants | Kuwait | 99.7 /100 | #65 | Exceptional 6.9% |
| Immigrants | Belgium | 99.6 /100 | #66 | Exceptional 6.9% |
| Immigrants | Netherlands | 99.5 /100 | #67 | Exceptional 7.0% |
| Paraguayans | 99.4 /100 | #68 | Exceptional 7.0% |
| Immigrants | Eritrea | 99.4 /100 | #69 | Exceptional 7.0% |
| Immigrants | Iraq | 99.4 /100 | #70 | Exceptional 7.0% |
| Afghans | 99.4 /100 | #71 | Exceptional 7.0% |
| Cubans | 99.4 /100 | #72 | Exceptional 7.0% |
| Immigrants | Czechoslovakia | 99.2 /100 | #73 | Exceptional 7.0% |
| Turks | 99.2 /100 | #74 | Exceptional 7.0% |
| Immigrants | Eastern Europe | 99.0 /100 | #75 | Exceptional 7.1% |
| Estonians | 99.0 /100 | #76 | Exceptional 7.1% |
Demographics Similar to Immigrants from West Indies by Unemployment Among Women with Children Under 6 years
In terms of unemployment among women with children under 6 years, the demographic groups most similar to Immigrants from West Indies are Hispanic or Latino (9.0%, a difference of 0.030%), Immigrants from Mexico (9.1%, a difference of 0.14%), Alaskan Athabascan (9.1%, a difference of 0.55%), Pueblo (9.1%, a difference of 0.73%), and Dominican (9.1%, a difference of 0.85%).
| Demographics | Rating | Rank | Unemployment Among Women with Children Under 6 years |
| Immigrants | Dominican Republic | 0.0 /100 | #296 | Tragic 8.9% |
| Mexicans | 0.0 /100 | #297 | Tragic 8.9% |
| Tlingit-Haida | 0.0 /100 | #298 | Tragic 8.9% |
| Immigrants | Jamaica | 0.0 /100 | #299 | Tragic 8.9% |
| Creek | 0.0 /100 | #300 | Tragic 8.9% |
| Chickasaw | 0.0 /100 | #301 | Tragic 9.0% |
| Hispanics or Latinos | 0.0 /100 | #302 | Tragic 9.0% |
| Immigrants | West Indies | 0.0 /100 | #303 | Tragic 9.0% |
| Immigrants | Mexico | 0.0 /100 | #304 | Tragic 9.1% |
| Alaskan Athabascans | 0.0 /100 | #305 | Tragic 9.1% |
| Pueblo | 0.0 /100 | #306 | Tragic 9.1% |
| Dominicans | 0.0 /100 | #307 | Tragic 9.1% |
| Immigrants | Micronesia | 0.0 /100 | #308 | Tragic 9.1% |
| Africans | 0.0 /100 | #309 | Tragic 9.2% |
| Cajuns | 0.0 /100 | #310 | Tragic 9.2% |