Ukrainian vs German Russian Unemployment Among Ages 35 to 44 years
COMPARE
Ukrainian
German Russian
Unemployment Among Ages 35 to 44 years
Unemployment Among Ages 35 to 44 years Comparison
Ukrainians
German Russians
4.6%
UNEMPLOYMENT AMONG AGES 35 TO 44 YEARS
75.8/ 100
METRIC RATING
142nd/ 347
METRIC RANK
4.7%
UNEMPLOYMENT AMONG AGES 35 TO 44 YEARS
57.2/ 100
METRIC RATING
165th/ 347
METRIC RANK
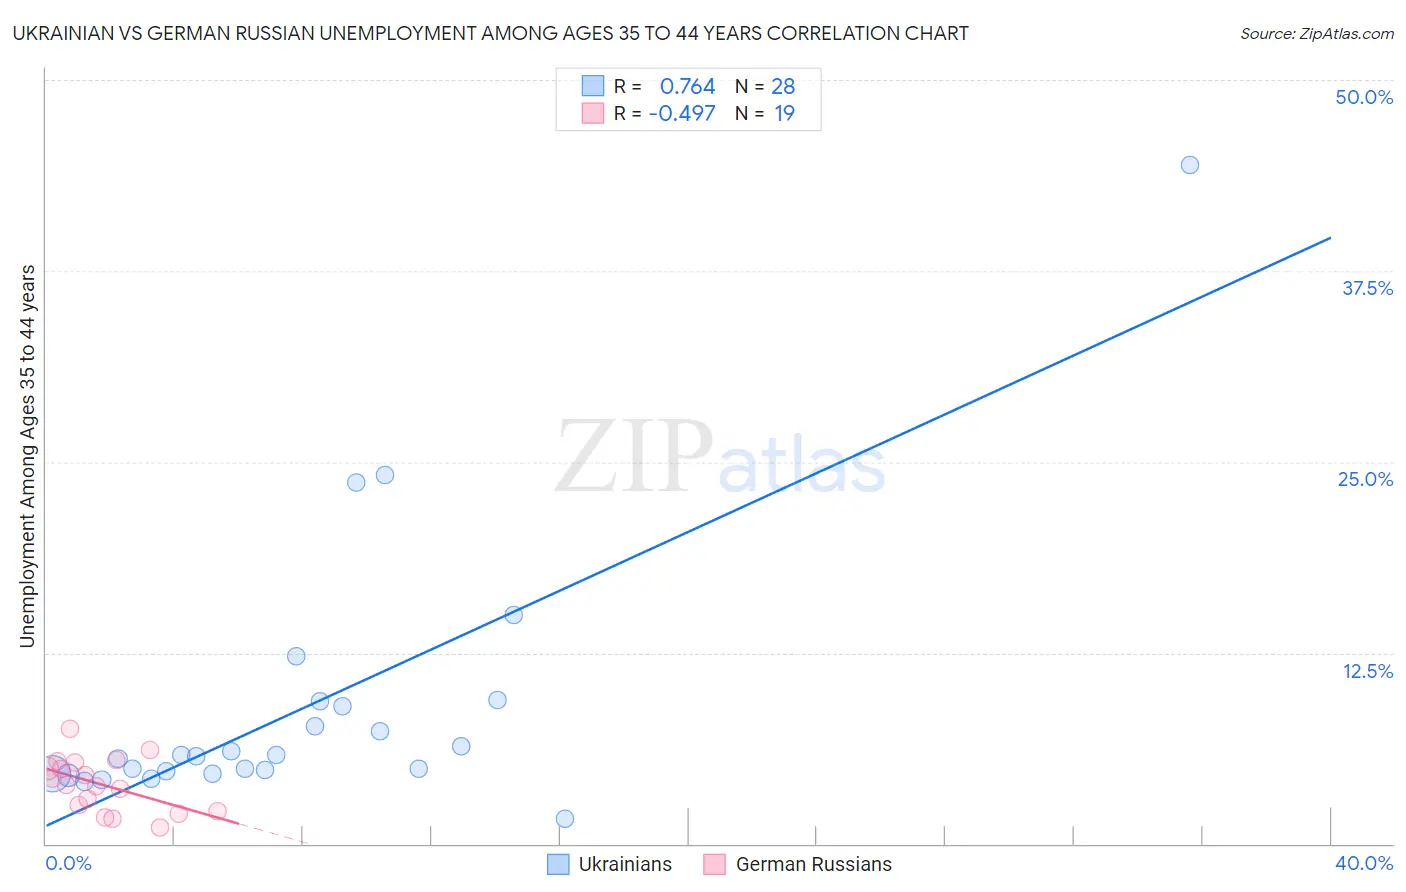
Ukrainian vs German Russian Unemployment Among Ages 35 to 44 years Correlation Chart
The statistical analysis conducted on geographies consisting of 432,289,403 people shows a strong positive correlation between the proportion of Ukrainians and unemployment rate among population between the ages 35 and 44 in the United States with a correlation coefficient (R) of 0.764 and weighted average of 4.6%. Similarly, the statistical analysis conducted on geographies consisting of 95,640,361 people shows a moderate negative correlation between the proportion of German Russians and unemployment rate among population between the ages 35 and 44 in the United States with a correlation coefficient (R) of -0.497 and weighted average of 4.7%, a difference of 1.5%.
Unemployment Among Ages 35 to 44 years Correlation Summary
| Measurement | Ukrainian | German Russian |
| Minimum | 1.6% | 1.1% |
| Maximum | 44.4% | 7.5% |
| Range | 42.8% | 6.4% |
| Mean | 8.9% | 3.9% |
| Median | 5.7% | 3.8% |
| Interquartile 25% (IQ1) | 4.7% | 2.1% |
| Interquartile 75% (IQ3) | 9.1% | 5.3% |
| Interquartile Range (IQR) | 4.5% | 3.2% |
| Standard Deviation (Sample) | 8.8% | 1.7% |
| Standard Deviation (Population) | 8.6% | 1.7% |
Similar Demographics by Unemployment Among Ages 35 to 44 years
Demographics Similar to Ukrainians by Unemployment Among Ages 35 to 44 years
In terms of unemployment among ages 35 to 44 years, the demographic groups most similar to Ukrainians are Canadian (4.6%, a difference of 0.010%), Immigrants from Eastern Africa (4.6%, a difference of 0.020%), Immigrants from Switzerland (4.6%, a difference of 0.030%), Immigrants from Russia (4.6%, a difference of 0.040%), and Immigrants from Hungary (4.6%, a difference of 0.050%).
| Demographics | Rating | Rank | Unemployment Among Ages 35 to 44 years |
| Immigrants | Europe | 79.4 /100 | #135 | Good 4.6% |
| Scotch-Irish | 79.3 /100 | #136 | Good 4.6% |
| Immigrants | Iraq | 78.9 /100 | #137 | Good 4.6% |
| Immigrants | Norway | 77.5 /100 | #138 | Good 4.6% |
| Immigrants | Hungary | 76.3 /100 | #139 | Good 4.6% |
| Immigrants | Eastern Africa | 76.0 /100 | #140 | Good 4.6% |
| Canadians | 75.9 /100 | #141 | Good 4.6% |
| Ukrainians | 75.8 /100 | #142 | Good 4.6% |
| Immigrants | Switzerland | 75.5 /100 | #143 | Good 4.6% |
| Immigrants | Russia | 75.4 /100 | #144 | Good 4.6% |
| Immigrants | Eastern Europe | 74.7 /100 | #145 | Good 4.6% |
| Immigrants | Denmark | 74.4 /100 | #146 | Good 4.6% |
| Immigrants | Vietnam | 73.8 /100 | #147 | Good 4.6% |
| Slavs | 72.4 /100 | #148 | Good 4.6% |
| Immigrants | Burma/Myanmar | 72.2 /100 | #149 | Good 4.6% |
Demographics Similar to German Russians by Unemployment Among Ages 35 to 44 years
In terms of unemployment among ages 35 to 44 years, the demographic groups most similar to German Russians are Immigrants from Morocco (4.7%, a difference of 0.0%), South African (4.7%, a difference of 0.10%), French (4.7%, a difference of 0.11%), Costa Rican (4.7%, a difference of 0.18%), and Peruvian (4.7%, a difference of 0.20%).
| Demographics | Rating | Rank | Unemployment Among Ages 35 to 44 years |
| Immigrants | Iran | 63.1 /100 | #158 | Good 4.6% |
| Albanians | 63.0 /100 | #159 | Good 4.6% |
| Hungarians | 62.6 /100 | #160 | Good 4.6% |
| Celtics | 61.7 /100 | #161 | Good 4.7% |
| Costa Ricans | 59.6 /100 | #162 | Average 4.7% |
| South Africans | 58.5 /100 | #163 | Average 4.7% |
| Immigrants | Morocco | 57.2 /100 | #164 | Average 4.7% |
| German Russians | 57.2 /100 | #165 | Average 4.7% |
| French | 55.6 /100 | #166 | Average 4.7% |
| Peruvians | 54.4 /100 | #167 | Average 4.7% |
| Arabs | 53.1 /100 | #168 | Average 4.7% |
| Pennsylvania Germans | 53.0 /100 | #169 | Average 4.7% |
| Immigrants | Indonesia | 52.6 /100 | #170 | Average 4.7% |
| Indonesians | 51.7 /100 | #171 | Average 4.7% |
| Lebanese | 51.4 /100 | #172 | Average 4.7% |