Immigrants from Latvia vs German Russian Unemployment Among Ages 35 to 44 years
COMPARE
Immigrants from Latvia
German Russian
Unemployment Among Ages 35 to 44 years
Unemployment Among Ages 35 to 44 years Comparison
Immigrants from Latvia
German Russians
4.4%
UNEMPLOYMENT AMONG AGES 35 TO 44 YEARS
94.8/ 100
METRIC RATING
88th/ 347
METRIC RANK
4.7%
UNEMPLOYMENT AMONG AGES 35 TO 44 YEARS
57.2/ 100
METRIC RATING
165th/ 347
METRIC RANK
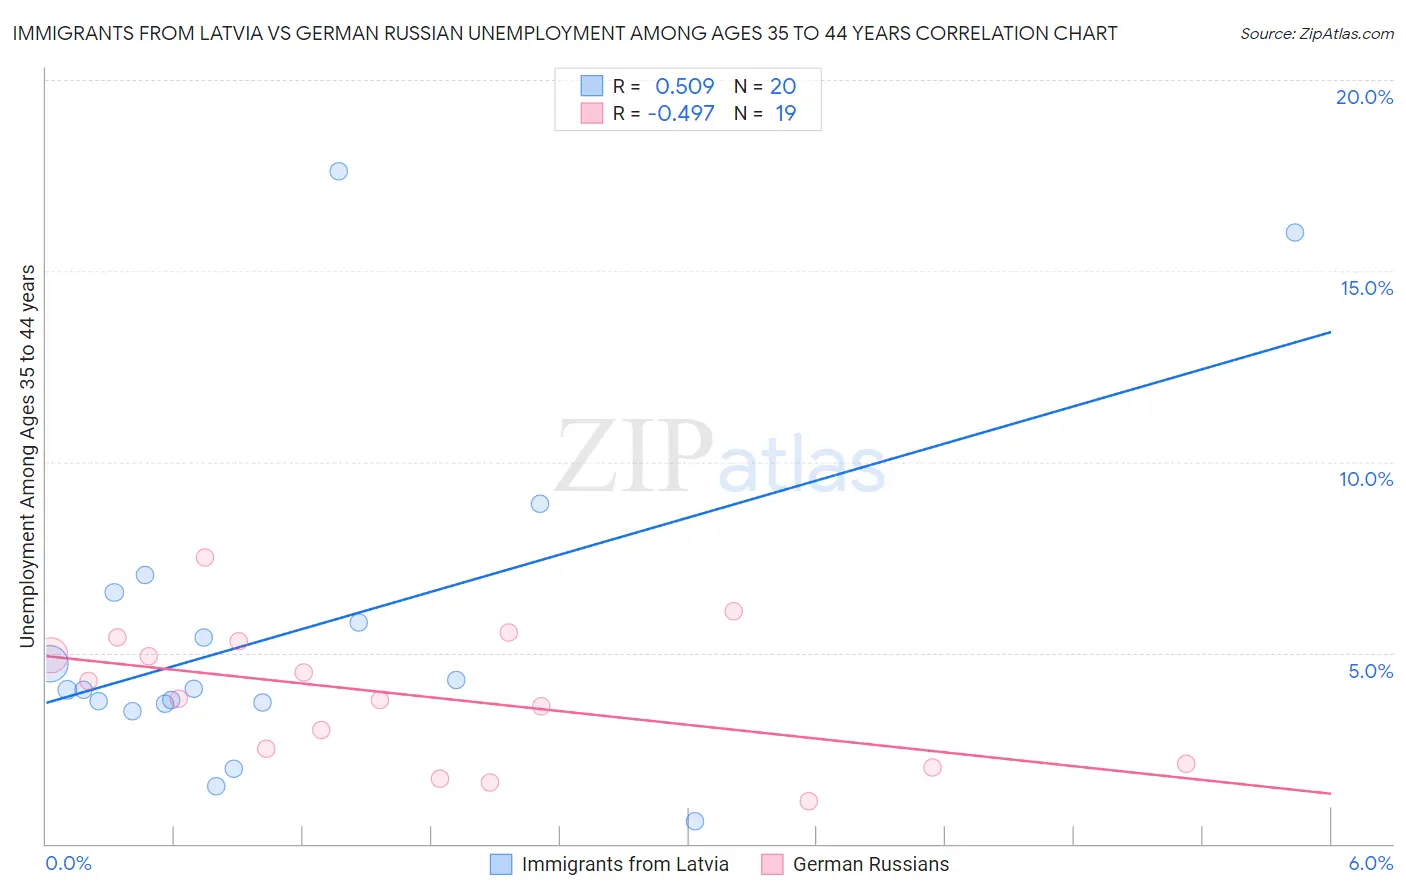
Immigrants from Latvia vs German Russian Unemployment Among Ages 35 to 44 years Correlation Chart
The statistical analysis conducted on geographies consisting of 113,083,847 people shows a substantial positive correlation between the proportion of Immigrants from Latvia and unemployment rate among population between the ages 35 and 44 in the United States with a correlation coefficient (R) of 0.509 and weighted average of 4.4%. Similarly, the statistical analysis conducted on geographies consisting of 95,640,361 people shows a moderate negative correlation between the proportion of German Russians and unemployment rate among population between the ages 35 and 44 in the United States with a correlation coefficient (R) of -0.497 and weighted average of 4.7%, a difference of 4.9%.
Unemployment Among Ages 35 to 44 years Correlation Summary
| Measurement | Immigrants from Latvia | German Russian |
| Minimum | 0.60% | 1.1% |
| Maximum | 17.6% | 7.5% |
| Range | 17.0% | 6.4% |
| Mean | 5.5% | 3.9% |
| Median | 4.0% | 3.8% |
| Interquartile 25% (IQ1) | 3.7% | 2.1% |
| Interquartile 75% (IQ3) | 6.2% | 5.3% |
| Interquartile Range (IQR) | 2.5% | 3.2% |
| Standard Deviation (Sample) | 4.3% | 1.7% |
| Standard Deviation (Population) | 4.2% | 1.7% |
Similar Demographics by Unemployment Among Ages 35 to 44 years
Demographics Similar to Immigrants from Latvia by Unemployment Among Ages 35 to 44 years
In terms of unemployment among ages 35 to 44 years, the demographic groups most similar to Immigrants from Latvia are Immigrants from Bosnia and Herzegovina (4.4%, a difference of 0.020%), Serbian (4.4%, a difference of 0.050%), Immigrants from Kenya (4.4%, a difference of 0.090%), Egyptian (4.5%, a difference of 0.090%), and Australian (4.5%, a difference of 0.11%).
| Demographics | Rating | Rank | Unemployment Among Ages 35 to 44 years |
| Immigrants | Scotland | 95.6 /100 | #81 | Exceptional 4.4% |
| Immigrants | Asia | 95.6 /100 | #82 | Exceptional 4.4% |
| Immigrants | Australia | 95.3 /100 | #83 | Exceptional 4.4% |
| Immigrants | Chile | 95.2 /100 | #84 | Exceptional 4.4% |
| Immigrants | Kenya | 95.0 /100 | #85 | Exceptional 4.4% |
| Serbians | 94.9 /100 | #86 | Exceptional 4.4% |
| Immigrants | Bosnia and Herzegovina | 94.8 /100 | #87 | Exceptional 4.4% |
| Immigrants | Latvia | 94.8 /100 | #88 | Exceptional 4.4% |
| Egyptians | 94.5 /100 | #89 | Exceptional 4.5% |
| Australians | 94.5 /100 | #90 | Exceptional 4.5% |
| Immigrants | Northern Europe | 94.3 /100 | #91 | Exceptional 4.5% |
| Estonians | 94.3 /100 | #92 | Exceptional 4.5% |
| Iranians | 93.9 /100 | #93 | Exceptional 4.5% |
| Russians | 93.8 /100 | #94 | Exceptional 4.5% |
| Yugoslavians | 93.6 /100 | #95 | Exceptional 4.5% |
Demographics Similar to German Russians by Unemployment Among Ages 35 to 44 years
In terms of unemployment among ages 35 to 44 years, the demographic groups most similar to German Russians are Immigrants from Morocco (4.7%, a difference of 0.0%), South African (4.7%, a difference of 0.10%), French (4.7%, a difference of 0.11%), Costa Rican (4.7%, a difference of 0.18%), and Peruvian (4.7%, a difference of 0.20%).
| Demographics | Rating | Rank | Unemployment Among Ages 35 to 44 years |
| Immigrants | Iran | 63.1 /100 | #158 | Good 4.6% |
| Albanians | 63.0 /100 | #159 | Good 4.6% |
| Hungarians | 62.6 /100 | #160 | Good 4.6% |
| Celtics | 61.7 /100 | #161 | Good 4.7% |
| Costa Ricans | 59.6 /100 | #162 | Average 4.7% |
| South Africans | 58.5 /100 | #163 | Average 4.7% |
| Immigrants | Morocco | 57.2 /100 | #164 | Average 4.7% |
| German Russians | 57.2 /100 | #165 | Average 4.7% |
| French | 55.6 /100 | #166 | Average 4.7% |
| Peruvians | 54.4 /100 | #167 | Average 4.7% |
| Arabs | 53.1 /100 | #168 | Average 4.7% |
| Pennsylvania Germans | 53.0 /100 | #169 | Average 4.7% |
| Immigrants | Indonesia | 52.6 /100 | #170 | Average 4.7% |
| Indonesians | 51.7 /100 | #171 | Average 4.7% |
| Lebanese | 51.4 /100 | #172 | Average 4.7% |