Ukrainian vs German Russian In Labor Force | Age 20-64
COMPARE
Ukrainian
German Russian
In Labor Force | Age 20-64
In Labor Force | Age 20-64 Comparison
Ukrainians
German Russians
79.9%
IN LABOR FORCE | AGE 20-64
86.8/ 100
METRIC RATING
135th/ 347
METRIC RANK
80.1%
IN LABOR FORCE | AGE 20-64
97.3/ 100
METRIC RATING
81st/ 347
METRIC RANK
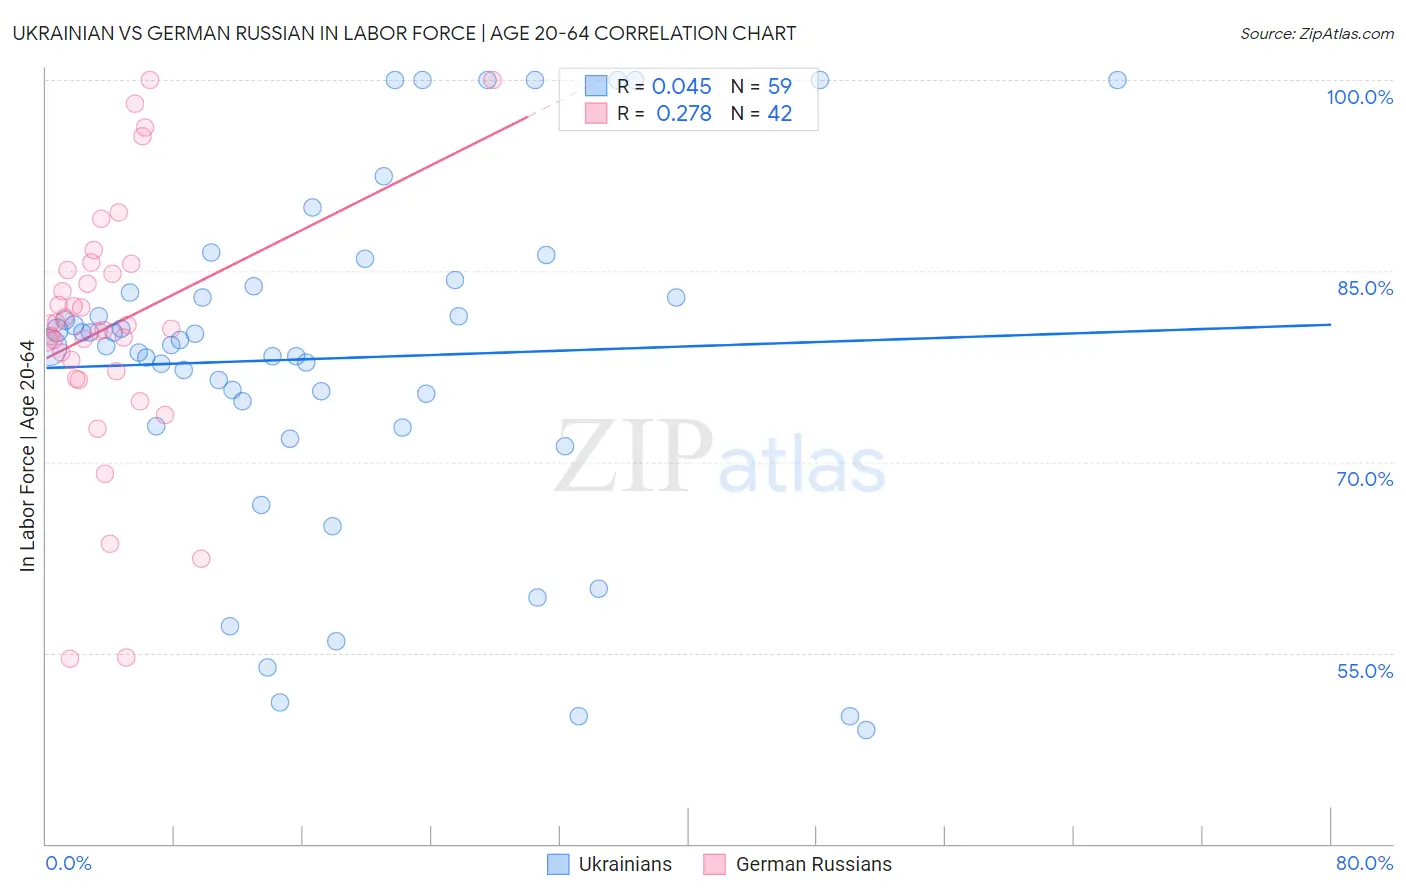
Ukrainian vs German Russian In Labor Force | Age 20-64 Correlation Chart
The statistical analysis conducted on geographies consisting of 448,709,826 people shows no correlation between the proportion of Ukrainians and labor force participation rate among population between the ages 20 and 64 in the United States with a correlation coefficient (R) of 0.045 and weighted average of 79.9%. Similarly, the statistical analysis conducted on geographies consisting of 96,458,963 people shows a weak positive correlation between the proportion of German Russians and labor force participation rate among population between the ages 20 and 64 in the United States with a correlation coefficient (R) of 0.278 and weighted average of 80.1%, a difference of 0.34%.
In Labor Force | Age 20-64 Correlation Summary
| Measurement | Ukrainian | German Russian |
| Minimum | 48.9% | 54.6% |
| Maximum | 100.0% | 100.0% |
| Range | 51.1% | 45.4% |
| Mean | 78.2% | 80.6% |
| Median | 79.2% | 80.7% |
| Interquartile 25% (IQ1) | 72.8% | 77.1% |
| Interquartile 75% (IQ3) | 83.8% | 85.1% |
| Interquartile Range (IQR) | 11.0% | 8.0% |
| Standard Deviation (Sample) | 13.4% | 10.1% |
| Standard Deviation (Population) | 13.3% | 9.9% |
Similar Demographics by In Labor Force | Age 20-64
Demographics Similar to Ukrainians by In Labor Force | Age 20-64
In terms of in labor force | age 20-64, the demographic groups most similar to Ukrainians are Immigrants from Singapore (79.9%, a difference of 0.0%), South American Indian (79.9%, a difference of 0.010%), Belgian (79.9%, a difference of 0.010%), Immigrants from Ukraine (79.9%, a difference of 0.010%), and Immigrants from Nigeria (79.9%, a difference of 0.010%).
| Demographics | Rating | Rank | In Labor Force | Age 20-64 |
| Immigrants | Eastern Asia | 89.4 /100 | #128 | Excellent 79.9% |
| Italians | 88.9 /100 | #129 | Excellent 79.9% |
| Immigrants | Zaire | 88.6 /100 | #130 | Excellent 79.9% |
| Immigrants | Iran | 88.3 /100 | #131 | Excellent 79.9% |
| Indians (Asian) | 87.7 /100 | #132 | Excellent 79.9% |
| South American Indians | 87.6 /100 | #133 | Excellent 79.9% |
| Belgians | 87.4 /100 | #134 | Excellent 79.9% |
| Ukrainians | 86.8 /100 | #135 | Excellent 79.9% |
| Immigrants | Singapore | 86.7 /100 | #136 | Excellent 79.9% |
| Immigrants | Ukraine | 86.5 /100 | #137 | Excellent 79.9% |
| Immigrants | Nigeria | 86.4 /100 | #138 | Excellent 79.9% |
| Immigrants | Spain | 83.9 /100 | #139 | Excellent 79.8% |
| Immigrants | South Eastern Asia | 80.4 /100 | #140 | Excellent 79.8% |
| Immigrants | Israel | 80.0 /100 | #141 | Good 79.8% |
| Slovaks | 79.9 /100 | #142 | Good 79.8% |
Demographics Similar to German Russians by In Labor Force | Age 20-64
In terms of in labor force | age 20-64, the demographic groups most similar to German Russians are Immigrants from Japan (80.1%, a difference of 0.0%), Colombian (80.1%, a difference of 0.0%), Immigrants from Latvia (80.1%, a difference of 0.010%), Jordanian (80.1%, a difference of 0.010%), and Immigrants from Egypt (80.1%, a difference of 0.010%).
| Demographics | Rating | Rank | In Labor Force | Age 20-64 |
| Immigrants | Eastern Europe | 98.1 /100 | #74 | Exceptional 80.2% |
| Immigrants | Afghanistan | 97.9 /100 | #75 | Exceptional 80.2% |
| Egyptians | 97.8 /100 | #76 | Exceptional 80.2% |
| Immigrants | Colombia | 97.8 /100 | #77 | Exceptional 80.2% |
| Immigrants | Romania | 97.8 /100 | #78 | Exceptional 80.2% |
| Asians | 97.7 /100 | #79 | Exceptional 80.2% |
| Immigrants | Croatia | 97.6 /100 | #80 | Exceptional 80.1% |
| German Russians | 97.3 /100 | #81 | Exceptional 80.1% |
| Immigrants | Japan | 97.3 /100 | #82 | Exceptional 80.1% |
| Colombians | 97.3 /100 | #83 | Exceptional 80.1% |
| Immigrants | Latvia | 97.2 /100 | #84 | Exceptional 80.1% |
| Jordanians | 97.2 /100 | #85 | Exceptional 80.1% |
| Immigrants | Egypt | 97.1 /100 | #86 | Exceptional 80.1% |
| Croatians | 97.1 /100 | #87 | Exceptional 80.1% |
| Chileans | 97.0 /100 | #88 | Exceptional 80.1% |