Immigrants from Micronesia vs Immigrants from El Salvador Unemployment Among Women with Children Under 6 years
COMPARE
Immigrants from Micronesia
Immigrants from El Salvador
Unemployment Among Women with Children Under 6 years
Unemployment Among Women with Children Under 6 years Comparison
Immigrants from Micronesia
Immigrants from El Salvador
9.1%
UNEMPLOYMENT AMONG WOMEN WITH CHILDREN UNDER 6 YEARS
0.0/ 100
METRIC RATING
308th/ 347
METRIC RANK
8.1%
UNEMPLOYMENT AMONG WOMEN WITH CHILDREN UNDER 6 YEARS
2.6/ 100
METRIC RATING
240th/ 347
METRIC RANK
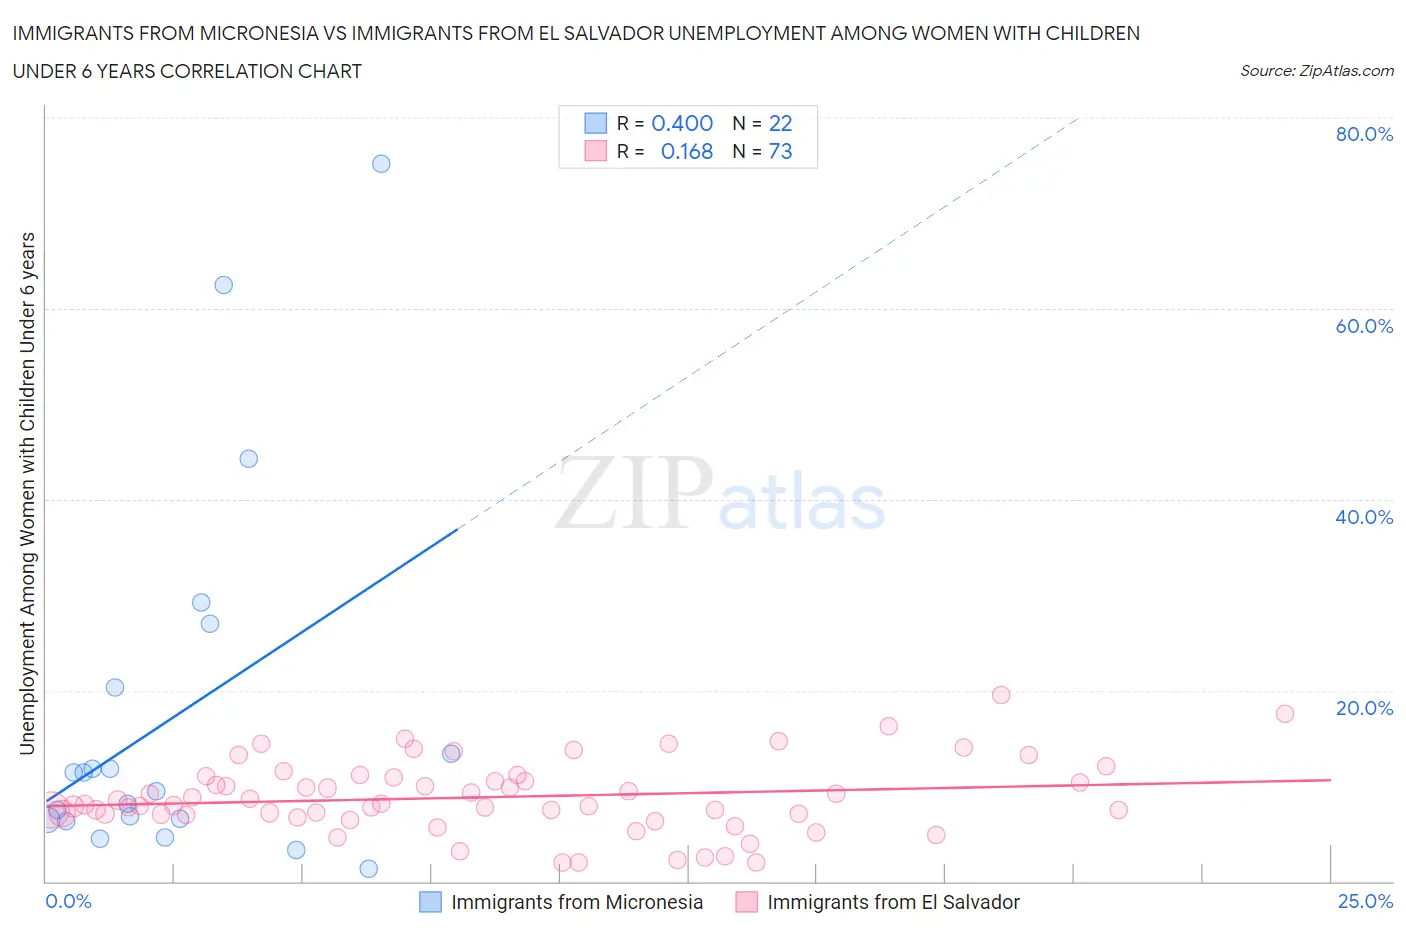
Immigrants from Micronesia vs Immigrants from El Salvador Unemployment Among Women with Children Under 6 years Correlation Chart
The statistical analysis conducted on geographies consisting of 56,683,877 people shows a moderate positive correlation between the proportion of Immigrants from Micronesia and unemployment rate among women with children under the age of 6 in the United States with a correlation coefficient (R) of 0.400 and weighted average of 9.1%. Similarly, the statistical analysis conducted on geographies consisting of 286,042,904 people shows a poor positive correlation between the proportion of Immigrants from El Salvador and unemployment rate among women with children under the age of 6 in the United States with a correlation coefficient (R) of 0.168 and weighted average of 8.1%, a difference of 12.6%.
Unemployment Among Women with Children Under 6 years Correlation Summary
| Measurement | Immigrants from Micronesia | Immigrants from El Salvador |
| Minimum | 1.3% | 1.9% |
| Maximum | 75.2% | 19.5% |
| Range | 73.9% | 17.6% |
| Mean | 17.4% | 8.8% |
| Median | 10.4% | 8.1% |
| Interquartile 25% (IQ1) | 6.4% | 7.0% |
| Interquartile 75% (IQ3) | 20.4% | 10.9% |
| Interquartile Range (IQR) | 14.0% | 4.0% |
| Standard Deviation (Sample) | 19.5% | 3.8% |
| Standard Deviation (Population) | 19.1% | 3.7% |
Similar Demographics by Unemployment Among Women with Children Under 6 years
Demographics Similar to Immigrants from Micronesia by Unemployment Among Women with Children Under 6 years
In terms of unemployment among women with children under 6 years, the demographic groups most similar to Immigrants from Micronesia are Dominican (9.1%, a difference of 0.070%), Pueblo (9.1%, a difference of 0.18%), Alaskan Athabascan (9.1%, a difference of 0.36%), African (9.2%, a difference of 0.39%), and Cajun (9.2%, a difference of 0.53%).
| Demographics | Rating | Rank | Unemployment Among Women with Children Under 6 years |
| Chickasaw | 0.0 /100 | #301 | Tragic 9.0% |
| Hispanics or Latinos | 0.0 /100 | #302 | Tragic 9.0% |
| Immigrants | West Indies | 0.0 /100 | #303 | Tragic 9.0% |
| Immigrants | Mexico | 0.0 /100 | #304 | Tragic 9.1% |
| Alaskan Athabascans | 0.0 /100 | #305 | Tragic 9.1% |
| Pueblo | 0.0 /100 | #306 | Tragic 9.1% |
| Dominicans | 0.0 /100 | #307 | Tragic 9.1% |
| Immigrants | Micronesia | 0.0 /100 | #308 | Tragic 9.1% |
| Africans | 0.0 /100 | #309 | Tragic 9.2% |
| Cajuns | 0.0 /100 | #310 | Tragic 9.2% |
| French American Indians | 0.0 /100 | #311 | Tragic 9.2% |
| Immigrants | Azores | 0.0 /100 | #312 | Tragic 9.2% |
| Americans | 0.0 /100 | #313 | Tragic 9.3% |
| Fijians | 0.0 /100 | #314 | Tragic 9.3% |
| Cherokee | 0.0 /100 | #315 | Tragic 9.3% |
Demographics Similar to Immigrants from El Salvador by Unemployment Among Women with Children Under 6 years
In terms of unemployment among women with children under 6 years, the demographic groups most similar to Immigrants from El Salvador are Liberian (8.1%, a difference of 0.030%), Irish (8.1%, a difference of 0.070%), Dutch (8.1%, a difference of 0.080%), Immigrants from Middle Africa (8.1%, a difference of 0.34%), and Hawaiian (8.2%, a difference of 0.64%).
| Demographics | Rating | Rank | Unemployment Among Women with Children Under 6 years |
| Immigrants | Trinidad and Tobago | 4.8 /100 | #233 | Tragic 8.0% |
| Kiowa | 4.4 /100 | #234 | Tragic 8.0% |
| Comanche | 4.3 /100 | #235 | Tragic 8.0% |
| Immigrants | Barbados | 4.2 /100 | #236 | Tragic 8.0% |
| Immigrants | Costa Rica | 4.1 /100 | #237 | Tragic 8.0% |
| Immigrants | Middle Africa | 3.2 /100 | #238 | Tragic 8.1% |
| Irish | 2.7 /100 | #239 | Tragic 8.1% |
| Immigrants | El Salvador | 2.6 /100 | #240 | Tragic 8.1% |
| Liberians | 2.6 /100 | #241 | Tragic 8.1% |
| Dutch | 2.5 /100 | #242 | Tragic 8.1% |
| Hawaiians | 1.8 /100 | #243 | Tragic 8.2% |
| French | 1.7 /100 | #244 | Tragic 8.2% |
| Native Hawaiians | 1.7 /100 | #245 | Tragic 8.2% |
| Central Americans | 1.4 /100 | #246 | Tragic 8.2% |
| German Russians | 1.2 /100 | #247 | Tragic 8.2% |