Immigrants from Oceania vs Immigrants from El Salvador Unemployment Among Women with Children Under 6 years
COMPARE
Immigrants from Oceania
Immigrants from El Salvador
Unemployment Among Women with Children Under 6 years
Unemployment Among Women with Children Under 6 years Comparison
Immigrants from Oceania
Immigrants from El Salvador
7.5%
UNEMPLOYMENT AMONG WOMEN WITH CHILDREN UNDER 6 YEARS
78.4/ 100
METRIC RATING
147th/ 347
METRIC RANK
8.1%
UNEMPLOYMENT AMONG WOMEN WITH CHILDREN UNDER 6 YEARS
2.6/ 100
METRIC RATING
240th/ 347
METRIC RANK
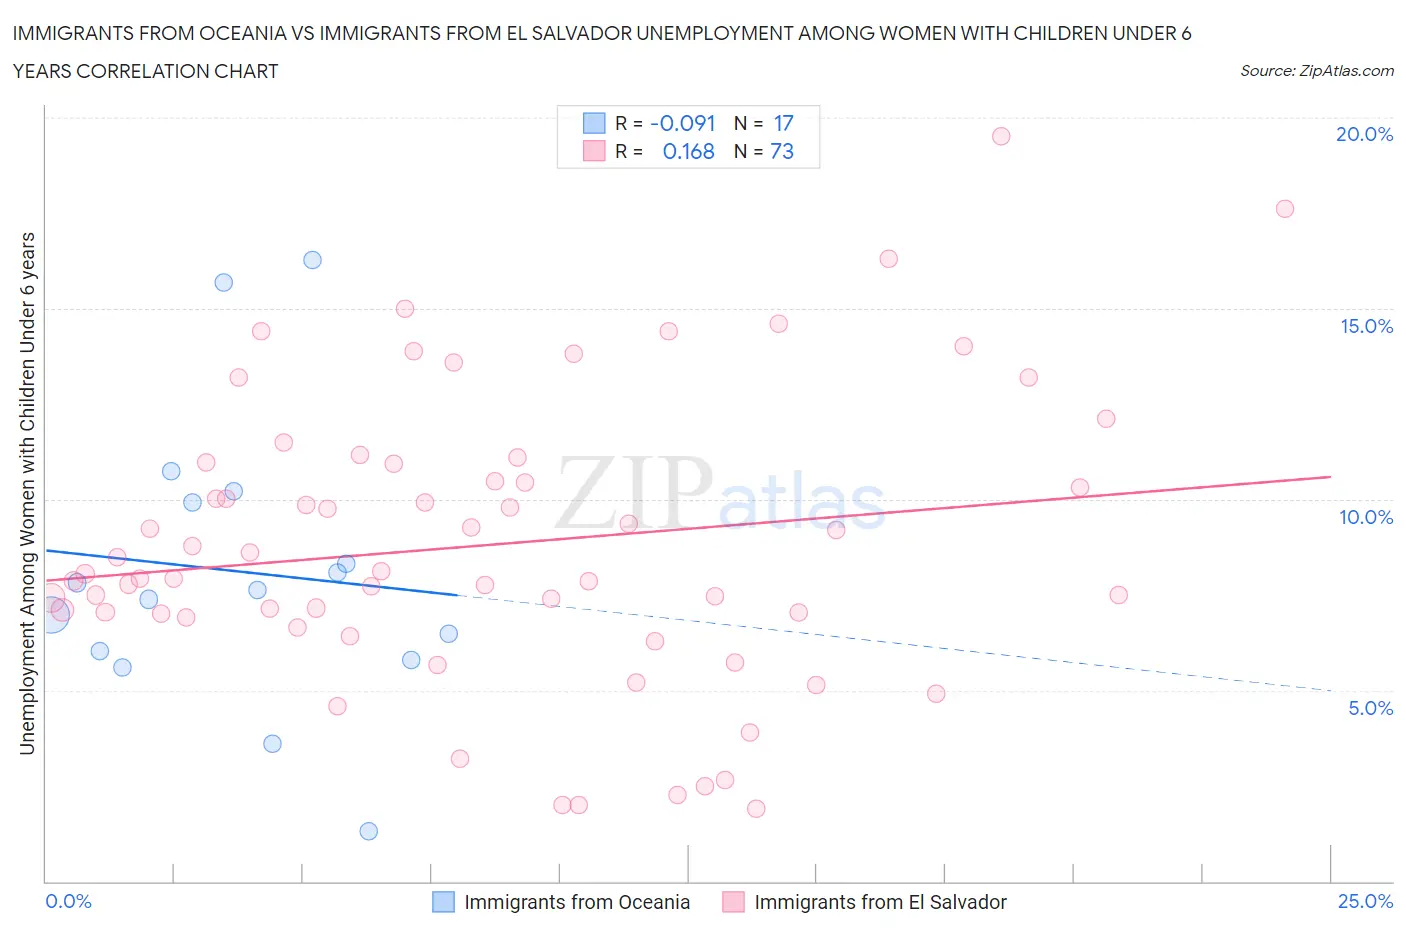
Immigrants from Oceania vs Immigrants from El Salvador Unemployment Among Women with Children Under 6 years Correlation Chart
The statistical analysis conducted on geographies consisting of 243,645,085 people shows a slight negative correlation between the proportion of Immigrants from Oceania and unemployment rate among women with children under the age of 6 in the United States with a correlation coefficient (R) of -0.091 and weighted average of 7.5%. Similarly, the statistical analysis conducted on geographies consisting of 286,042,904 people shows a poor positive correlation between the proportion of Immigrants from El Salvador and unemployment rate among women with children under the age of 6 in the United States with a correlation coefficient (R) of 0.168 and weighted average of 8.1%, a difference of 8.3%.
Unemployment Among Women with Children Under 6 years Correlation Summary
| Measurement | Immigrants from Oceania | Immigrants from El Salvador |
| Minimum | 1.3% | 1.9% |
| Maximum | 16.3% | 19.5% |
| Range | 15.0% | 17.6% |
| Mean | 8.1% | 8.8% |
| Median | 7.6% | 8.1% |
| Interquartile 25% (IQ1) | 5.9% | 7.0% |
| Interquartile 75% (IQ3) | 10.1% | 10.9% |
| Interquartile Range (IQR) | 4.2% | 4.0% |
| Standard Deviation (Sample) | 3.8% | 3.8% |
| Standard Deviation (Population) | 3.7% | 3.7% |
Similar Demographics by Unemployment Among Women with Children Under 6 years
Demographics Similar to Immigrants from Oceania by Unemployment Among Women with Children Under 6 years
In terms of unemployment among women with children under 6 years, the demographic groups most similar to Immigrants from Oceania are Immigrants from Jordan (7.5%, a difference of 0.050%), Japanese (7.5%, a difference of 0.050%), European (7.5%, a difference of 0.070%), Immigrants from Brazil (7.5%, a difference of 0.11%), and Colombian (7.5%, a difference of 0.22%).
| Demographics | Rating | Rank | Unemployment Among Women with Children Under 6 years |
| Scandinavians | 83.0 /100 | #140 | Excellent 7.4% |
| Greeks | 82.6 /100 | #141 | Excellent 7.4% |
| Immigrants | Argentina | 81.5 /100 | #142 | Excellent 7.5% |
| Koreans | 81.3 /100 | #143 | Excellent 7.5% |
| Europeans | 79.1 /100 | #144 | Good 7.5% |
| Immigrants | Jordan | 78.9 /100 | #145 | Good 7.5% |
| Japanese | 78.9 /100 | #146 | Good 7.5% |
| Immigrants | Oceania | 78.4 /100 | #147 | Good 7.5% |
| Immigrants | Brazil | 77.3 /100 | #148 | Good 7.5% |
| Colombians | 76.1 /100 | #149 | Good 7.5% |
| Aleuts | 76.0 /100 | #150 | Good 7.5% |
| Immigrants | Peru | 74.9 /100 | #151 | Good 7.5% |
| Bangladeshis | 74.8 /100 | #152 | Good 7.5% |
| Uruguayans | 74.7 /100 | #153 | Good 7.5% |
| Northern Europeans | 74.3 /100 | #154 | Good 7.5% |
Demographics Similar to Immigrants from El Salvador by Unemployment Among Women with Children Under 6 years
In terms of unemployment among women with children under 6 years, the demographic groups most similar to Immigrants from El Salvador are Liberian (8.1%, a difference of 0.030%), Irish (8.1%, a difference of 0.070%), Dutch (8.1%, a difference of 0.080%), Immigrants from Middle Africa (8.1%, a difference of 0.34%), and Hawaiian (8.2%, a difference of 0.64%).
| Demographics | Rating | Rank | Unemployment Among Women with Children Under 6 years |
| Immigrants | Trinidad and Tobago | 4.8 /100 | #233 | Tragic 8.0% |
| Kiowa | 4.4 /100 | #234 | Tragic 8.0% |
| Comanche | 4.3 /100 | #235 | Tragic 8.0% |
| Immigrants | Barbados | 4.2 /100 | #236 | Tragic 8.0% |
| Immigrants | Costa Rica | 4.1 /100 | #237 | Tragic 8.0% |
| Immigrants | Middle Africa | 3.2 /100 | #238 | Tragic 8.1% |
| Irish | 2.7 /100 | #239 | Tragic 8.1% |
| Immigrants | El Salvador | 2.6 /100 | #240 | Tragic 8.1% |
| Liberians | 2.6 /100 | #241 | Tragic 8.1% |
| Dutch | 2.5 /100 | #242 | Tragic 8.1% |
| Hawaiians | 1.8 /100 | #243 | Tragic 8.2% |
| French | 1.7 /100 | #244 | Tragic 8.2% |
| Native Hawaiians | 1.7 /100 | #245 | Tragic 8.2% |
| Central Americans | 1.4 /100 | #246 | Tragic 8.2% |
| German Russians | 1.2 /100 | #247 | Tragic 8.2% |