Trinidadian and Tobagonian vs Immigrants from Yemen Unemployment Among Ages 20 to 24 years
COMPARE
Trinidadian and Tobagonian
Immigrants from Yemen
Unemployment Among Ages 20 to 24 years
Unemployment Among Ages 20 to 24 years Comparison
Trinidadians and Tobagonians
Immigrants from Yemen
12.9%
UNEMPLOYMENT AMONG AGES 20 TO 24 YEARS
0.0/ 100
METRIC RATING
319th/ 347
METRIC RANK
14.9%
UNEMPLOYMENT AMONG AGES 20 TO 24 YEARS
0.0/ 100
METRIC RATING
339th/ 347
METRIC RANK
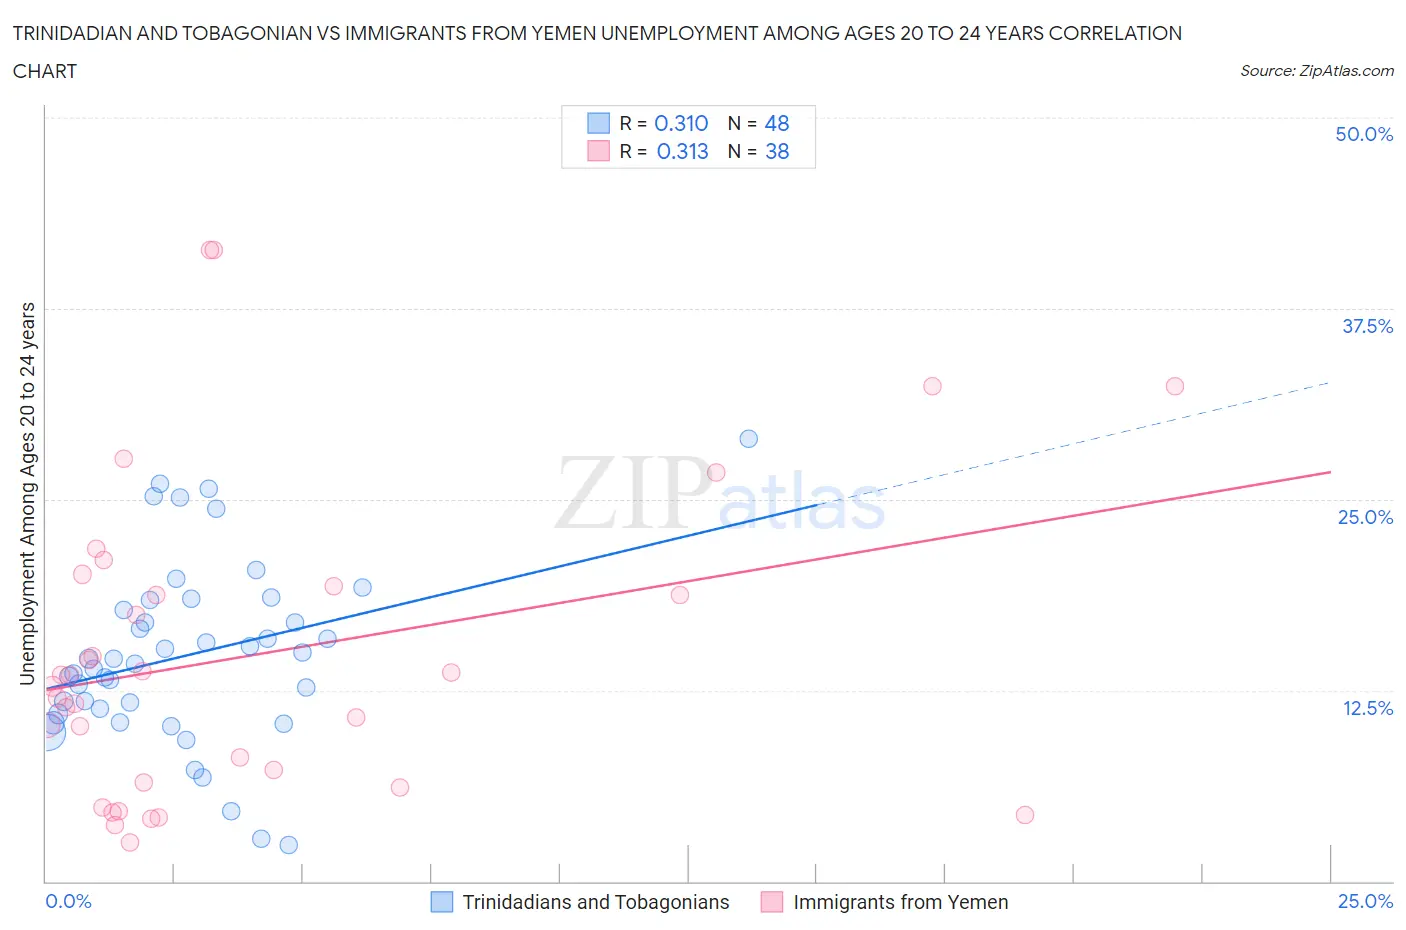
Trinidadian and Tobagonian vs Immigrants from Yemen Unemployment Among Ages 20 to 24 years Correlation Chart
The statistical analysis conducted on geographies consisting of 216,876,201 people shows a mild positive correlation between the proportion of Trinidadians and Tobagonians and unemployment rate among population between the ages 20 and 24 in the United States with a correlation coefficient (R) of 0.310 and weighted average of 12.9%. Similarly, the statistical analysis conducted on geographies consisting of 82,154,441 people shows a mild positive correlation between the proportion of Immigrants from Yemen and unemployment rate among population between the ages 20 and 24 in the United States with a correlation coefficient (R) of 0.313 and weighted average of 14.9%, a difference of 15.4%.
Unemployment Among Ages 20 to 24 years Correlation Summary
| Measurement | Trinidadian and Tobagonian | Immigrants from Yemen |
| Minimum | 2.4% | 2.5% |
| Maximum | 29.0% | 41.3% |
| Range | 26.6% | 38.8% |
| Mean | 14.8% | 14.8% |
| Median | 14.4% | 13.1% |
| Interquartile 25% (IQ1) | 11.1% | 6.5% |
| Interquartile 75% (IQ3) | 18.1% | 19.3% |
| Interquartile Range (IQR) | 6.9% | 12.8% |
| Standard Deviation (Sample) | 5.9% | 10.1% |
| Standard Deviation (Population) | 5.8% | 10.0% |
Demographics Similar to Trinidadians and Tobagonians and Immigrants from Yemen by Unemployment Among Ages 20 to 24 years
In terms of unemployment among ages 20 to 24 years, the demographic groups most similar to Trinidadians and Tobagonians are Cheyenne (13.0%, a difference of 0.42%), Immigrants from Jamaica (13.0%, a difference of 0.51%), Native/Alaskan (13.0%, a difference of 0.89%), Yakama (13.1%, a difference of 1.4%), and Alaska Native (13.2%, a difference of 2.4%). Similarly, the demographic groups most similar to Immigrants from Yemen are Immigrants from St. Vincent and the Grenadines (14.3%, a difference of 3.8%), Paiute (14.3%, a difference of 3.8%), Pima (14.2%, a difference of 4.9%), Sioux (14.2%, a difference of 5.1%), and Guyanese (14.0%, a difference of 6.4%).
| Demographics | Rating | Rank | Unemployment Among Ages 20 to 24 years |
| Trinidadians and Tobagonians | 0.0 /100 | #319 | Tragic 12.9% |
| Cheyenne | 0.0 /100 | #320 | Tragic 13.0% |
| Immigrants | Jamaica | 0.0 /100 | #321 | Tragic 13.0% |
| Natives/Alaskans | 0.0 /100 | #322 | Tragic 13.0% |
| Yakama | 0.0 /100 | #323 | Tragic 13.1% |
| Alaska Natives | 0.0 /100 | #324 | Tragic 13.2% |
| Pueblo | 0.0 /100 | #325 | Tragic 13.2% |
| Immigrants | Barbados | 0.0 /100 | #326 | Tragic 13.5% |
| Immigrants | Dominican Republic | 0.0 /100 | #327 | Tragic 13.6% |
| British West Indians | 0.0 /100 | #328 | Tragic 13.7% |
| Dominicans | 0.0 /100 | #329 | Tragic 13.8% |
| Arapaho | 0.0 /100 | #330 | Tragic 13.8% |
| Aleuts | 0.0 /100 | #331 | Tragic 13.8% |
| Immigrants | Grenada | 0.0 /100 | #332 | Tragic 13.8% |
| Immigrants | Guyana | 0.0 /100 | #333 | Tragic 13.9% |
| Guyanese | 0.0 /100 | #334 | Tragic 14.0% |
| Sioux | 0.0 /100 | #335 | Tragic 14.2% |
| Pima | 0.0 /100 | #336 | Tragic 14.2% |
| Paiute | 0.0 /100 | #337 | Tragic 14.3% |
| Immigrants | St. Vincent and the Grenadines | 0.0 /100 | #338 | Tragic 14.3% |
| Immigrants | Yemen | 0.0 /100 | #339 | Tragic 14.9% |