Trinidadian and Tobagonian vs Ute Unemployment Among Ages 20 to 24 years
COMPARE
Trinidadian and Tobagonian
Ute
Unemployment Among Ages 20 to 24 years
Unemployment Among Ages 20 to 24 years Comparison
Trinidadians and Tobagonians
Ute
12.9%
UNEMPLOYMENT AMONG AGES 20 TO 24 YEARS
0.0/ 100
METRIC RATING
319th/ 347
METRIC RANK
11.2%
UNEMPLOYMENT AMONG AGES 20 TO 24 YEARS
0.0/ 100
METRIC RATING
269th/ 347
METRIC RANK
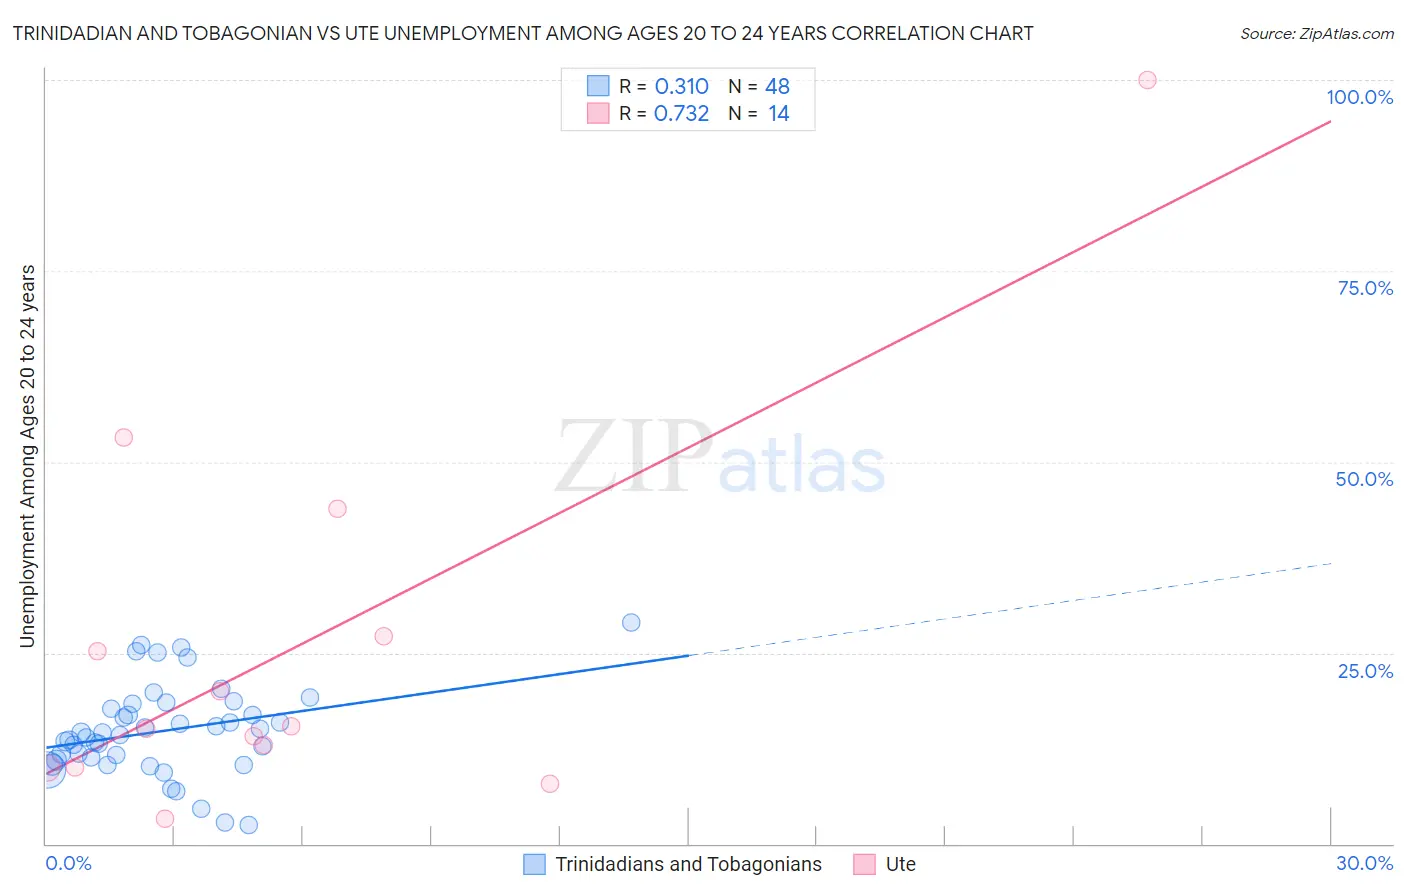
Trinidadian and Tobagonian vs Ute Unemployment Among Ages 20 to 24 years Correlation Chart
The statistical analysis conducted on geographies consisting of 216,876,201 people shows a mild positive correlation between the proportion of Trinidadians and Tobagonians and unemployment rate among population between the ages 20 and 24 in the United States with a correlation coefficient (R) of 0.310 and weighted average of 12.9%. Similarly, the statistical analysis conducted on geographies consisting of 55,243,819 people shows a strong positive correlation between the proportion of Ute and unemployment rate among population between the ages 20 and 24 in the United States with a correlation coefficient (R) of 0.732 and weighted average of 11.2%, a difference of 15.0%.
Unemployment Among Ages 20 to 24 years Correlation Summary
| Measurement | Trinidadian and Tobagonian | Ute |
| Minimum | 2.4% | 3.2% |
| Maximum | 29.0% | 100.0% |
| Range | 26.6% | 96.8% |
| Mean | 14.8% | 25.6% |
| Median | 14.4% | 15.2% |
| Interquartile 25% (IQ1) | 11.1% | 10.0% |
| Interquartile 75% (IQ3) | 18.1% | 27.1% |
| Interquartile Range (IQR) | 6.9% | 17.1% |
| Standard Deviation (Sample) | 5.9% | 25.5% |
| Standard Deviation (Population) | 5.8% | 24.6% |
Similar Demographics by Unemployment Among Ages 20 to 24 years
Demographics Similar to Trinidadians and Tobagonians by Unemployment Among Ages 20 to 24 years
In terms of unemployment among ages 20 to 24 years, the demographic groups most similar to Trinidadians and Tobagonians are Barbadian (12.9%, a difference of 0.25%), Cheyenne (13.0%, a difference of 0.42%), Immigrants from Trinidad and Tobago (12.8%, a difference of 0.51%), Immigrants from Jamaica (13.0%, a difference of 0.51%), and Immigrants from Dominica (12.8%, a difference of 0.63%).
| Demographics | Rating | Rank | Unemployment Among Ages 20 to 24 years |
| Houma | 0.0 /100 | #312 | Tragic 12.6% |
| Shoshone | 0.0 /100 | #313 | Tragic 12.7% |
| Blacks/African Americans | 0.0 /100 | #314 | Tragic 12.7% |
| West Indians | 0.0 /100 | #315 | Tragic 12.8% |
| Immigrants | Dominica | 0.0 /100 | #316 | Tragic 12.8% |
| Immigrants | Trinidad and Tobago | 0.0 /100 | #317 | Tragic 12.8% |
| Barbadians | 0.0 /100 | #318 | Tragic 12.9% |
| Trinidadians and Tobagonians | 0.0 /100 | #319 | Tragic 12.9% |
| Cheyenne | 0.0 /100 | #320 | Tragic 13.0% |
| Immigrants | Jamaica | 0.0 /100 | #321 | Tragic 13.0% |
| Natives/Alaskans | 0.0 /100 | #322 | Tragic 13.0% |
| Yakama | 0.0 /100 | #323 | Tragic 13.1% |
| Alaska Natives | 0.0 /100 | #324 | Tragic 13.2% |
| Pueblo | 0.0 /100 | #325 | Tragic 13.2% |
| Immigrants | Barbados | 0.0 /100 | #326 | Tragic 13.5% |
Demographics Similar to Ute by Unemployment Among Ages 20 to 24 years
In terms of unemployment among ages 20 to 24 years, the demographic groups most similar to Ute are Maltese (11.2%, a difference of 0.39%), Delaware (11.3%, a difference of 0.58%), Immigrants from Greece (11.1%, a difference of 0.83%), Immigrants from Liberia (11.1%, a difference of 1.1%), and Immigrants from Ireland (11.1%, a difference of 1.2%).
| Demographics | Rating | Rank | Unemployment Among Ages 20 to 24 years |
| Immigrants | Latin America | 0.1 /100 | #262 | Tragic 11.0% |
| Marshallese | 0.1 /100 | #263 | Tragic 11.0% |
| Sub-Saharan Africans | 0.0 /100 | #264 | Tragic 11.1% |
| Immigrants | Ireland | 0.0 /100 | #265 | Tragic 11.1% |
| Immigrants | Liberia | 0.0 /100 | #266 | Tragic 11.1% |
| Immigrants | Greece | 0.0 /100 | #267 | Tragic 11.1% |
| Maltese | 0.0 /100 | #268 | Tragic 11.2% |
| Ute | 0.0 /100 | #269 | Tragic 11.2% |
| Delaware | 0.0 /100 | #270 | Tragic 11.3% |
| Immigrants | Uzbekistan | 0.0 /100 | #271 | Tragic 11.4% |
| Nigerians | 0.0 /100 | #272 | Tragic 11.4% |
| Immigrants | Nigeria | 0.0 /100 | #273 | Tragic 11.5% |
| Cape Verdeans | 0.0 /100 | #274 | Tragic 11.5% |
| Senegalese | 0.0 /100 | #275 | Tragic 11.5% |
| Sierra Leoneans | 0.0 /100 | #276 | Tragic 11.5% |