Trinidadian and Tobagonian vs Immigrants from Sierra Leone Unemployment Among Youth under 25 years
COMPARE
Trinidadian and Tobagonian
Immigrants from Sierra Leone
Unemployment Among Youth under 25 years
Unemployment Among Youth under 25 years Comparison
Trinidadians and Tobagonians
Immigrants from Sierra Leone
14.6%
UNEMPLOYMENT AMONG YOUTH UNDER 25 YEARS
0.0/ 100
METRIC RATING
322nd/ 347
METRIC RANK
13.8%
UNEMPLOYMENT AMONG YOUTH UNDER 25 YEARS
0.0/ 100
METRIC RATING
302nd/ 347
METRIC RANK
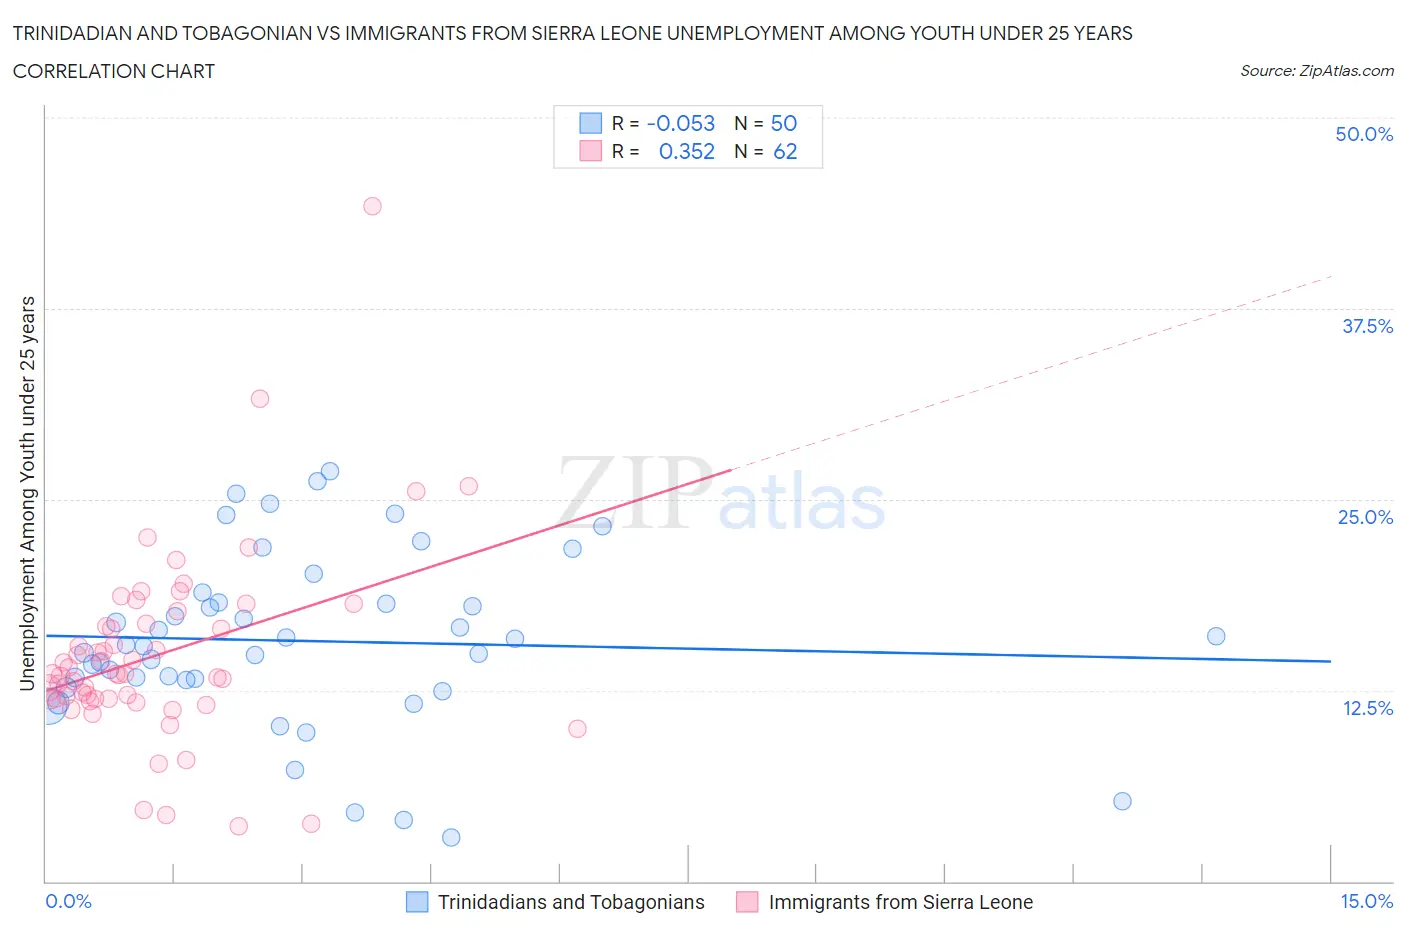
Trinidadian and Tobagonian vs Immigrants from Sierra Leone Unemployment Among Youth under 25 years Correlation Chart
The statistical analysis conducted on geographies consisting of 218,912,692 people shows a slight negative correlation between the proportion of Trinidadians and Tobagonians and unemployment rate among youth under the age of 25 in the United States with a correlation coefficient (R) of -0.053 and weighted average of 14.6%. Similarly, the statistical analysis conducted on geographies consisting of 101,393,183 people shows a mild positive correlation between the proportion of Immigrants from Sierra Leone and unemployment rate among youth under the age of 25 in the United States with a correlation coefficient (R) of 0.352 and weighted average of 13.8%, a difference of 5.8%.
Unemployment Among Youth under 25 years Correlation Summary
| Measurement | Trinidadian and Tobagonian | Immigrants from Sierra Leone |
| Minimum | 2.9% | 3.6% |
| Maximum | 26.9% | 44.2% |
| Range | 24.0% | 40.6% |
| Mean | 15.7% | 14.8% |
| Median | 15.4% | 13.5% |
| Interquartile 25% (IQ1) | 13.2% | 12.0% |
| Interquartile 75% (IQ3) | 18.3% | 16.9% |
| Interquartile Range (IQR) | 5.1% | 4.9% |
| Standard Deviation (Sample) | 5.7% | 6.3% |
| Standard Deviation (Population) | 5.6% | 6.2% |
Demographics Similar to Trinidadians and Tobagonians and Immigrants from Sierra Leone by Unemployment Among Youth under 25 years
In terms of unemployment among youth under 25 years, the demographic groups most similar to Trinidadians and Tobagonians are Cheyenne (14.6%, a difference of 0.070%), Barbadian (14.6%, a difference of 0.23%), West Indian (14.6%, a difference of 0.27%), Immigrants from Dominica (14.6%, a difference of 0.31%), and Black/African American (14.5%, a difference of 1.0%). Similarly, the demographic groups most similar to Immigrants from Sierra Leone are Belizean (13.8%, a difference of 0.040%), Houma (13.8%, a difference of 0.040%), Haitian (13.9%, a difference of 0.37%), Pueblo (13.9%, a difference of 0.44%), and Immigrants from Haiti (14.0%, a difference of 0.93%).
| Demographics | Rating | Rank | Unemployment Among Youth under 25 years |
| Immigrants | Sierra Leone | 0.0 /100 | #302 | Tragic 13.8% |
| Belizeans | 0.0 /100 | #303 | Tragic 13.8% |
| Houma | 0.0 /100 | #304 | Tragic 13.8% |
| Haitians | 0.0 /100 | #305 | Tragic 13.9% |
| Pueblo | 0.0 /100 | #306 | Tragic 13.9% |
| Immigrants | Haiti | 0.0 /100 | #307 | Tragic 14.0% |
| Immigrants | Belize | 0.0 /100 | #308 | Tragic 14.0% |
| Aleuts | 0.0 /100 | #309 | Tragic 14.1% |
| Immigrants | West Indies | 0.0 /100 | #310 | Tragic 14.2% |
| Immigrants | Bangladesh | 0.0 /100 | #311 | Tragic 14.2% |
| Vietnamese | 0.0 /100 | #312 | Tragic 14.3% |
| Immigrants | Armenia | 0.0 /100 | #313 | Tragic 14.4% |
| Jamaicans | 0.0 /100 | #314 | Tragic 14.4% |
| Sioux | 0.0 /100 | #315 | Tragic 14.4% |
| Natives/Alaskans | 0.0 /100 | #316 | Tragic 14.5% |
| Blacks/African Americans | 0.0 /100 | #317 | Tragic 14.5% |
| Immigrants | Dominica | 0.0 /100 | #318 | Tragic 14.6% |
| West Indians | 0.0 /100 | #319 | Tragic 14.6% |
| Barbadians | 0.0 /100 | #320 | Tragic 14.6% |
| Cheyenne | 0.0 /100 | #321 | Tragic 14.6% |
| Trinidadians and Tobagonians | 0.0 /100 | #322 | Tragic 14.6% |