Slovak vs Immigrants from Sierra Leone Unemployment Among Youth under 25 years
COMPARE
Slovak
Immigrants from Sierra Leone
Unemployment Among Youth under 25 years
Unemployment Among Youth under 25 years Comparison
Slovaks
Immigrants from Sierra Leone
11.4%
UNEMPLOYMENT AMONG YOUTH UNDER 25 YEARS
88.9/ 100
METRIC RATING
121st/ 347
METRIC RANK
13.8%
UNEMPLOYMENT AMONG YOUTH UNDER 25 YEARS
0.0/ 100
METRIC RATING
302nd/ 347
METRIC RANK
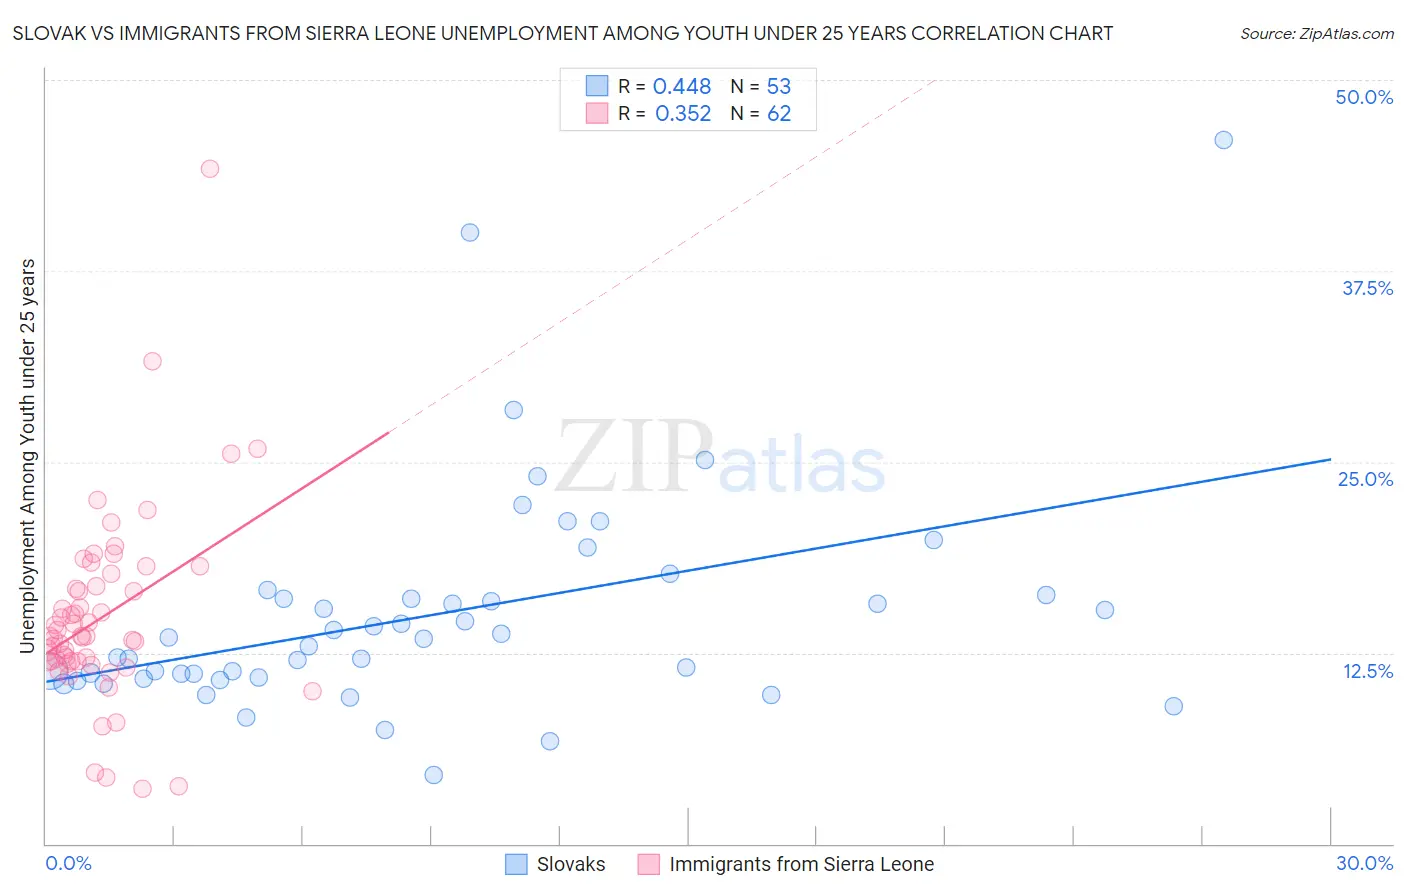
Slovak vs Immigrants from Sierra Leone Unemployment Among Youth under 25 years Correlation Chart
The statistical analysis conducted on geographies consisting of 390,838,184 people shows a moderate positive correlation between the proportion of Slovaks and unemployment rate among youth under the age of 25 in the United States with a correlation coefficient (R) of 0.448 and weighted average of 11.4%. Similarly, the statistical analysis conducted on geographies consisting of 101,393,183 people shows a mild positive correlation between the proportion of Immigrants from Sierra Leone and unemployment rate among youth under the age of 25 in the United States with a correlation coefficient (R) of 0.352 and weighted average of 13.8%, a difference of 21.7%.
Unemployment Among Youth under 25 years Correlation Summary
| Measurement | Slovak | Immigrants from Sierra Leone |
| Minimum | 4.5% | 3.6% |
| Maximum | 46.1% | 44.2% |
| Range | 41.6% | 40.6% |
| Mean | 15.0% | 14.8% |
| Median | 13.4% | 13.5% |
| Interquartile 25% (IQ1) | 10.9% | 12.0% |
| Interquartile 75% (IQ3) | 16.2% | 16.9% |
| Interquartile Range (IQR) | 5.3% | 4.9% |
| Standard Deviation (Sample) | 7.3% | 6.3% |
| Standard Deviation (Population) | 7.3% | 6.2% |
Similar Demographics by Unemployment Among Youth under 25 years
Demographics Similar to Slovaks by Unemployment Among Youth under 25 years
In terms of unemployment among youth under 25 years, the demographic groups most similar to Slovaks are Malaysian (11.4%, a difference of 0.020%), Immigrants from Scotland (11.4%, a difference of 0.040%), Immigrants from Micronesia (11.4%, a difference of 0.080%), Afghan (11.3%, a difference of 0.090%), and Burmese (11.3%, a difference of 0.10%).
| Demographics | Rating | Rank | Unemployment Among Youth under 25 years |
| Immigrants | Ethiopia | 89.9 /100 | #114 | Excellent 11.3% |
| Immigrants | Vietnam | 89.9 /100 | #115 | Excellent 11.3% |
| Burmese | 89.8 /100 | #116 | Excellent 11.3% |
| Sri Lankans | 89.8 /100 | #117 | Excellent 11.3% |
| Afghans | 89.7 /100 | #118 | Excellent 11.3% |
| Immigrants | Scotland | 89.2 /100 | #119 | Excellent 11.4% |
| Malaysians | 89.0 /100 | #120 | Excellent 11.4% |
| Slovaks | 88.9 /100 | #121 | Excellent 11.4% |
| Immigrants | Micronesia | 88.1 /100 | #122 | Excellent 11.4% |
| Basques | 87.8 /100 | #123 | Excellent 11.4% |
| Italians | 87.2 /100 | #124 | Excellent 11.4% |
| Immigrants | Argentina | 87.2 /100 | #125 | Excellent 11.4% |
| Canadians | 86.6 /100 | #126 | Excellent 11.4% |
| Greeks | 86.2 /100 | #127 | Excellent 11.4% |
| Immigrants | Hungary | 86.0 /100 | #128 | Excellent 11.4% |
Demographics Similar to Immigrants from Sierra Leone by Unemployment Among Youth under 25 years
In terms of unemployment among youth under 25 years, the demographic groups most similar to Immigrants from Sierra Leone are Belizean (13.8%, a difference of 0.040%), Houma (13.8%, a difference of 0.040%), Immigrants from Senegal (13.8%, a difference of 0.050%), Immigrants from Cabo Verde (13.8%, a difference of 0.22%), and Haitian (13.9%, a difference of 0.37%).
| Demographics | Rating | Rank | Unemployment Among Youth under 25 years |
| Chippewa | 0.0 /100 | #295 | Tragic 13.5% |
| Senegalese | 0.0 /100 | #296 | Tragic 13.5% |
| U.S. Virgin Islanders | 0.0 /100 | #297 | Tragic 13.6% |
| Shoshone | 0.0 /100 | #298 | Tragic 13.7% |
| Tohono O'odham | 0.0 /100 | #299 | Tragic 13.8% |
| Immigrants | Cabo Verde | 0.0 /100 | #300 | Tragic 13.8% |
| Immigrants | Senegal | 0.0 /100 | #301 | Tragic 13.8% |
| Immigrants | Sierra Leone | 0.0 /100 | #302 | Tragic 13.8% |
| Belizeans | 0.0 /100 | #303 | Tragic 13.8% |
| Houma | 0.0 /100 | #304 | Tragic 13.8% |
| Haitians | 0.0 /100 | #305 | Tragic 13.9% |
| Pueblo | 0.0 /100 | #306 | Tragic 13.9% |
| Immigrants | Haiti | 0.0 /100 | #307 | Tragic 14.0% |
| Immigrants | Belize | 0.0 /100 | #308 | Tragic 14.0% |
| Aleuts | 0.0 /100 | #309 | Tragic 14.1% |