Immigrants from Jamaica vs Immigrants from Sierra Leone Unemployment Among Youth under 25 years
COMPARE
Immigrants from Jamaica
Immigrants from Sierra Leone
Unemployment Among Youth under 25 years
Unemployment Among Youth under 25 years Comparison
Immigrants from Jamaica
Immigrants from Sierra Leone
14.8%
UNEMPLOYMENT AMONG YOUTH UNDER 25 YEARS
0.0/ 100
METRIC RATING
324th/ 347
METRIC RANK
13.8%
UNEMPLOYMENT AMONG YOUTH UNDER 25 YEARS
0.0/ 100
METRIC RATING
302nd/ 347
METRIC RANK
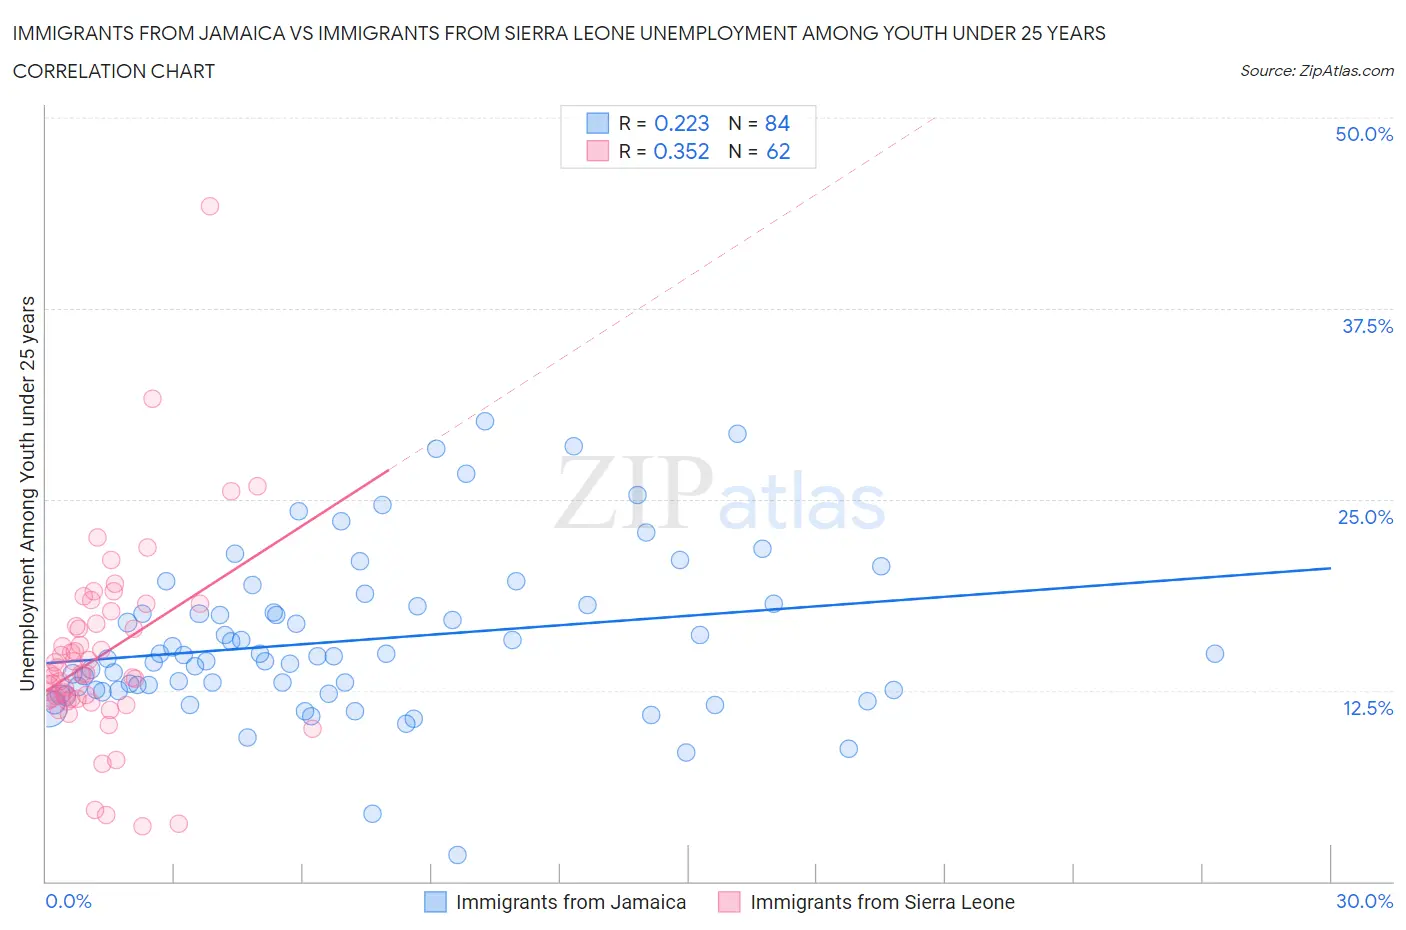
Immigrants from Jamaica vs Immigrants from Sierra Leone Unemployment Among Youth under 25 years Correlation Chart
The statistical analysis conducted on geographies consisting of 299,263,200 people shows a weak positive correlation between the proportion of Immigrants from Jamaica and unemployment rate among youth under the age of 25 in the United States with a correlation coefficient (R) of 0.223 and weighted average of 14.8%. Similarly, the statistical analysis conducted on geographies consisting of 101,393,183 people shows a mild positive correlation between the proportion of Immigrants from Sierra Leone and unemployment rate among youth under the age of 25 in the United States with a correlation coefficient (R) of 0.352 and weighted average of 13.8%, a difference of 7.1%.
Unemployment Among Youth under 25 years Correlation Summary
| Measurement | Immigrants from Jamaica | Immigrants from Sierra Leone |
| Minimum | 1.7% | 3.6% |
| Maximum | 30.1% | 44.2% |
| Range | 28.4% | 40.6% |
| Mean | 15.8% | 14.8% |
| Median | 14.7% | 13.5% |
| Interquartile 25% (IQ1) | 12.5% | 12.0% |
| Interquartile 75% (IQ3) | 18.0% | 16.9% |
| Interquartile Range (IQR) | 5.6% | 4.9% |
| Standard Deviation (Sample) | 5.3% | 6.3% |
| Standard Deviation (Population) | 5.2% | 6.2% |
Similar Demographics by Unemployment Among Youth under 25 years
Demographics Similar to Immigrants from Jamaica by Unemployment Among Youth under 25 years
In terms of unemployment among youth under 25 years, the demographic groups most similar to Immigrants from Jamaica are Alaska Native (14.9%, a difference of 0.67%), Immigrants from Trinidad and Tobago (14.6%, a difference of 1.2%), Trinidadian and Tobagonian (14.6%, a difference of 1.3%), Cheyenne (14.6%, a difference of 1.3%), and Barbadian (14.6%, a difference of 1.5%).
| Demographics | Rating | Rank | Unemployment Among Youth under 25 years |
| Blacks/African Americans | 0.0 /100 | #317 | Tragic 14.5% |
| Immigrants | Dominica | 0.0 /100 | #318 | Tragic 14.6% |
| West Indians | 0.0 /100 | #319 | Tragic 14.6% |
| Barbadians | 0.0 /100 | #320 | Tragic 14.6% |
| Cheyenne | 0.0 /100 | #321 | Tragic 14.6% |
| Trinidadians and Tobagonians | 0.0 /100 | #322 | Tragic 14.6% |
| Immigrants | Trinidad and Tobago | 0.0 /100 | #323 | Tragic 14.6% |
| Immigrants | Jamaica | 0.0 /100 | #324 | Tragic 14.8% |
| Alaska Natives | 0.0 /100 | #325 | Tragic 14.9% |
| Immigrants | Barbados | 0.0 /100 | #326 | Tragic 15.2% |
| British West Indians | 0.0 /100 | #327 | Tragic 15.5% |
| Immigrants | Dominican Republic | 0.0 /100 | #328 | Tragic 15.6% |
| Immigrants | Yemen | 0.0 /100 | #329 | Tragic 15.6% |
| Yakama | 0.0 /100 | #330 | Tragic 15.6% |
| Dominicans | 0.0 /100 | #331 | Tragic 15.7% |
Demographics Similar to Immigrants from Sierra Leone by Unemployment Among Youth under 25 years
In terms of unemployment among youth under 25 years, the demographic groups most similar to Immigrants from Sierra Leone are Belizean (13.8%, a difference of 0.040%), Houma (13.8%, a difference of 0.040%), Immigrants from Senegal (13.8%, a difference of 0.050%), Immigrants from Cabo Verde (13.8%, a difference of 0.22%), and Haitian (13.9%, a difference of 0.37%).
| Demographics | Rating | Rank | Unemployment Among Youth under 25 years |
| Chippewa | 0.0 /100 | #295 | Tragic 13.5% |
| Senegalese | 0.0 /100 | #296 | Tragic 13.5% |
| U.S. Virgin Islanders | 0.0 /100 | #297 | Tragic 13.6% |
| Shoshone | 0.0 /100 | #298 | Tragic 13.7% |
| Tohono O'odham | 0.0 /100 | #299 | Tragic 13.8% |
| Immigrants | Cabo Verde | 0.0 /100 | #300 | Tragic 13.8% |
| Immigrants | Senegal | 0.0 /100 | #301 | Tragic 13.8% |
| Immigrants | Sierra Leone | 0.0 /100 | #302 | Tragic 13.8% |
| Belizeans | 0.0 /100 | #303 | Tragic 13.8% |
| Houma | 0.0 /100 | #304 | Tragic 13.8% |
| Haitians | 0.0 /100 | #305 | Tragic 13.9% |
| Pueblo | 0.0 /100 | #306 | Tragic 13.9% |
| Immigrants | Haiti | 0.0 /100 | #307 | Tragic 14.0% |
| Immigrants | Belize | 0.0 /100 | #308 | Tragic 14.0% |
| Aleuts | 0.0 /100 | #309 | Tragic 14.1% |