Trinidadian and Tobagonian vs Immigrants from Barbados Unemployment Among Youth under 25 years
COMPARE
Trinidadian and Tobagonian
Immigrants from Barbados
Unemployment Among Youth under 25 years
Unemployment Among Youth under 25 years Comparison
Trinidadians and Tobagonians
Immigrants from Barbados
14.6%
UNEMPLOYMENT AMONG YOUTH UNDER 25 YEARS
0.0/ 100
METRIC RATING
322nd/ 347
METRIC RANK
15.2%
UNEMPLOYMENT AMONG YOUTH UNDER 25 YEARS
0.0/ 100
METRIC RATING
326th/ 347
METRIC RANK
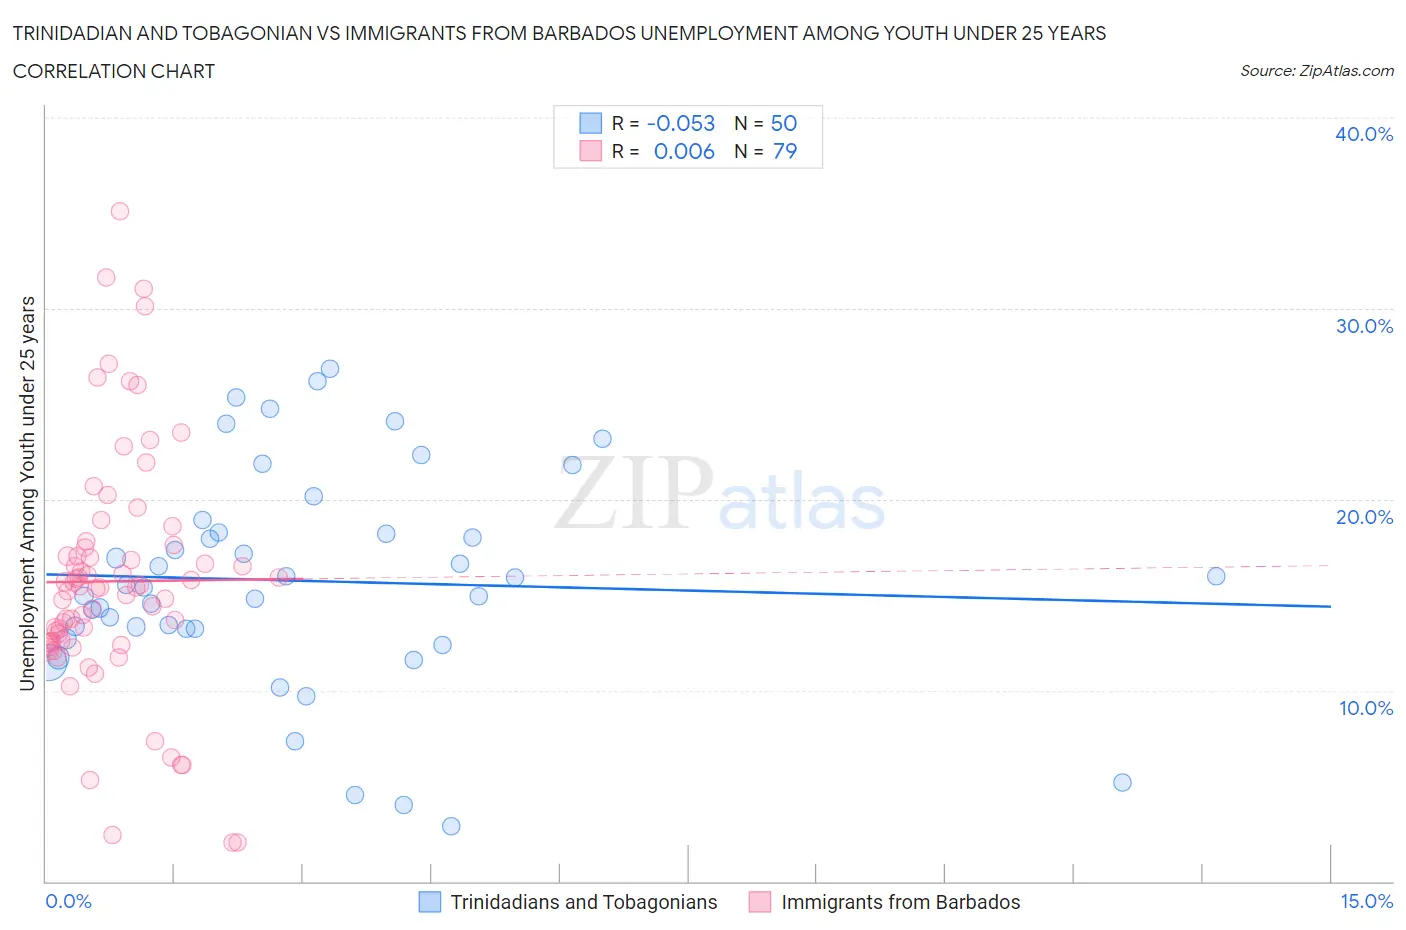
Trinidadian and Tobagonian vs Immigrants from Barbados Unemployment Among Youth under 25 years Correlation Chart
The statistical analysis conducted on geographies consisting of 218,912,692 people shows a slight negative correlation between the proportion of Trinidadians and Tobagonians and unemployment rate among youth under the age of 25 in the United States with a correlation coefficient (R) of -0.053 and weighted average of 14.6%. Similarly, the statistical analysis conducted on geographies consisting of 112,488,242 people shows no correlation between the proportion of Immigrants from Barbados and unemployment rate among youth under the age of 25 in the United States with a correlation coefficient (R) of 0.006 and weighted average of 15.2%, a difference of 4.2%.
Unemployment Among Youth under 25 years Correlation Summary
| Measurement | Trinidadian and Tobagonian | Immigrants from Barbados |
| Minimum | 2.9% | 2.0% |
| Maximum | 26.9% | 35.1% |
| Range | 24.0% | 33.1% |
| Mean | 15.7% | 15.7% |
| Median | 15.4% | 15.4% |
| Interquartile 25% (IQ1) | 13.2% | 12.5% |
| Interquartile 75% (IQ3) | 18.3% | 17.5% |
| Interquartile Range (IQR) | 5.1% | 5.0% |
| Standard Deviation (Sample) | 5.7% | 6.3% |
| Standard Deviation (Population) | 5.6% | 6.3% |
Demographics Similar to Trinidadians and Tobagonians and Immigrants from Barbados by Unemployment Among Youth under 25 years
In terms of unemployment among youth under 25 years, the demographic groups most similar to Trinidadians and Tobagonians are Cheyenne (14.6%, a difference of 0.070%), Immigrants from Trinidad and Tobago (14.6%, a difference of 0.090%), Barbadian (14.6%, a difference of 0.23%), West Indian (14.6%, a difference of 0.27%), and Immigrants from Dominica (14.6%, a difference of 0.31%). Similarly, the demographic groups most similar to Immigrants from Barbados are British West Indian (15.5%, a difference of 2.1%), Immigrants from Dominican Republic (15.6%, a difference of 2.2%), Alaska Native (14.9%, a difference of 2.2%), Immigrants from Yemen (15.6%, a difference of 2.3%), and Yakama (15.6%, a difference of 2.3%).
| Demographics | Rating | Rank | Unemployment Among Youth under 25 years |
| Jamaicans | 0.0 /100 | #314 | Tragic 14.4% |
| Sioux | 0.0 /100 | #315 | Tragic 14.4% |
| Natives/Alaskans | 0.0 /100 | #316 | Tragic 14.5% |
| Blacks/African Americans | 0.0 /100 | #317 | Tragic 14.5% |
| Immigrants | Dominica | 0.0 /100 | #318 | Tragic 14.6% |
| West Indians | 0.0 /100 | #319 | Tragic 14.6% |
| Barbadians | 0.0 /100 | #320 | Tragic 14.6% |
| Cheyenne | 0.0 /100 | #321 | Tragic 14.6% |
| Trinidadians and Tobagonians | 0.0 /100 | #322 | Tragic 14.6% |
| Immigrants | Trinidad and Tobago | 0.0 /100 | #323 | Tragic 14.6% |
| Immigrants | Jamaica | 0.0 /100 | #324 | Tragic 14.8% |
| Alaska Natives | 0.0 /100 | #325 | Tragic 14.9% |
| Immigrants | Barbados | 0.0 /100 | #326 | Tragic 15.2% |
| British West Indians | 0.0 /100 | #327 | Tragic 15.5% |
| Immigrants | Dominican Republic | 0.0 /100 | #328 | Tragic 15.6% |
| Immigrants | Yemen | 0.0 /100 | #329 | Tragic 15.6% |
| Yakama | 0.0 /100 | #330 | Tragic 15.6% |
| Dominicans | 0.0 /100 | #331 | Tragic 15.7% |
| Immigrants | Grenada | 0.0 /100 | #332 | Tragic 15.8% |
| Guyanese | 0.0 /100 | #333 | Tragic 15.9% |
| Immigrants | Guyana | 0.0 /100 | #334 | Tragic 15.9% |