Immigrants from Korea vs Immigrants from Barbados Unemployment Among Youth under 25 years
COMPARE
Immigrants from Korea
Immigrants from Barbados
Unemployment Among Youth under 25 years
Unemployment Among Youth under 25 years Comparison
Immigrants from Korea
Immigrants from Barbados
11.5%
UNEMPLOYMENT AMONG YOUTH UNDER 25 YEARS
75.1/ 100
METRIC RATING
142nd/ 347
METRIC RANK
15.2%
UNEMPLOYMENT AMONG YOUTH UNDER 25 YEARS
0.0/ 100
METRIC RATING
326th/ 347
METRIC RANK
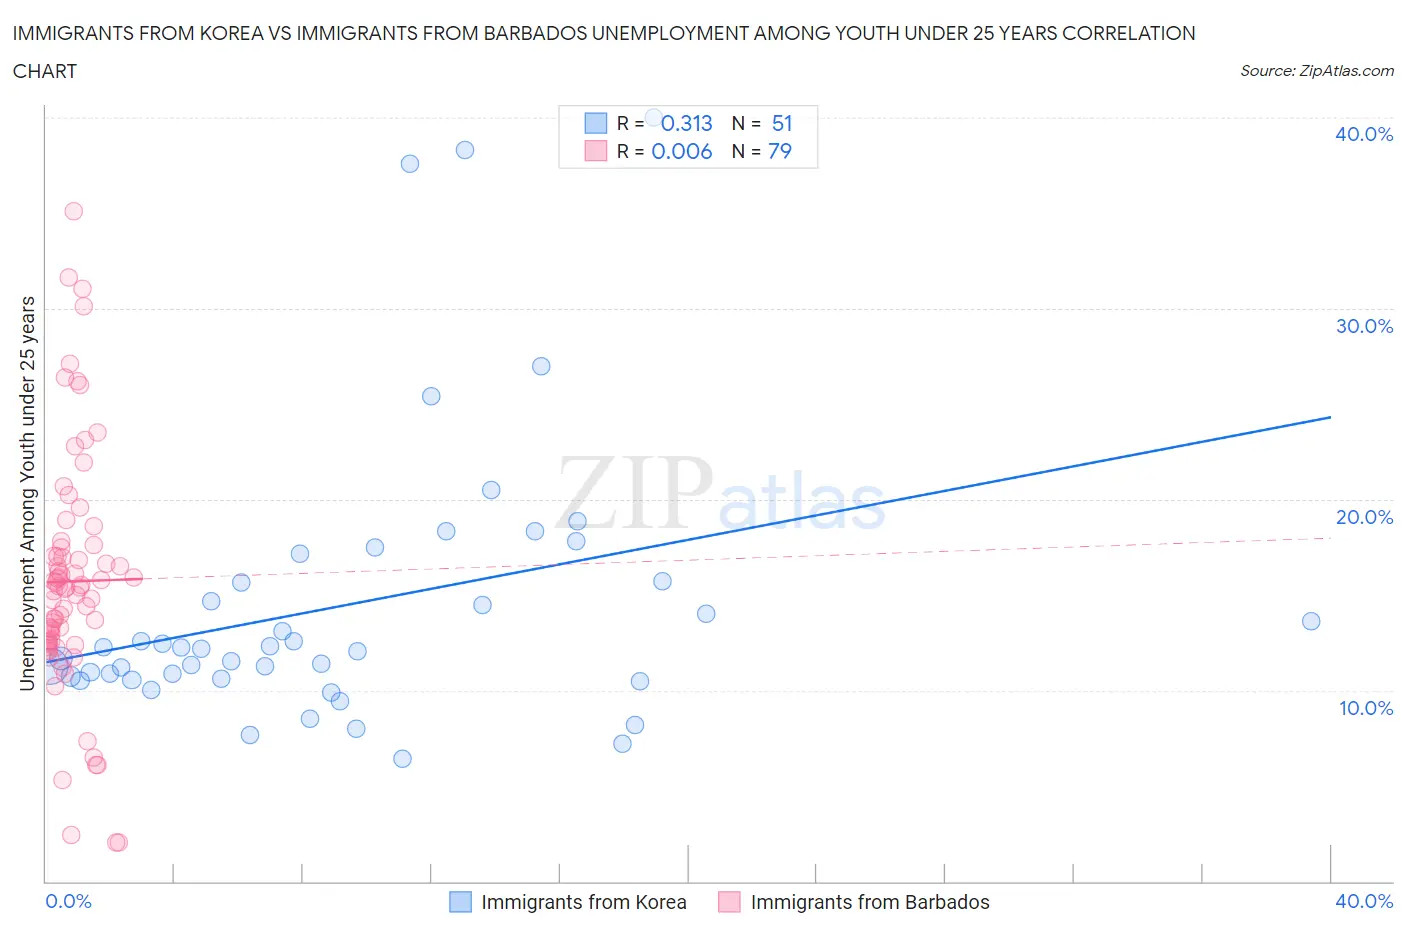
Immigrants from Korea vs Immigrants from Barbados Unemployment Among Youth under 25 years Correlation Chart
The statistical analysis conducted on geographies consisting of 411,086,531 people shows a mild positive correlation between the proportion of Immigrants from Korea and unemployment rate among youth under the age of 25 in the United States with a correlation coefficient (R) of 0.313 and weighted average of 11.5%. Similarly, the statistical analysis conducted on geographies consisting of 112,488,242 people shows no correlation between the proportion of Immigrants from Barbados and unemployment rate among youth under the age of 25 in the United States with a correlation coefficient (R) of 0.006 and weighted average of 15.2%, a difference of 32.8%.
Unemployment Among Youth under 25 years Correlation Summary
| Measurement | Immigrants from Korea | Immigrants from Barbados |
| Minimum | 6.4% | 2.0% |
| Maximum | 40.0% | 35.1% |
| Range | 33.6% | 33.1% |
| Mean | 14.5% | 15.7% |
| Median | 12.2% | 15.4% |
| Interquartile 25% (IQ1) | 10.6% | 12.5% |
| Interquartile 75% (IQ3) | 15.7% | 17.5% |
| Interquartile Range (IQR) | 5.1% | 5.0% |
| Standard Deviation (Sample) | 7.4% | 6.3% |
| Standard Deviation (Population) | 7.3% | 6.3% |
Similar Demographics by Unemployment Among Youth under 25 years
Demographics Similar to Immigrants from Korea by Unemployment Among Youth under 25 years
In terms of unemployment among youth under 25 years, the demographic groups most similar to Immigrants from Korea are Immigrants from Uganda (11.5%, a difference of 0.040%), Immigrants from Uruguay (11.5%, a difference of 0.050%), Immigrants from Brazil (11.5%, a difference of 0.050%), Argentinean (11.5%, a difference of 0.12%), and Immigrants from Indonesia (11.5%, a difference of 0.14%).
| Demographics | Rating | Rank | Unemployment Among Youth under 25 years |
| Immigrants | Oceania | 80.2 /100 | #135 | Excellent 11.4% |
| Romanians | 80.1 /100 | #136 | Excellent 11.4% |
| Asians | 79.7 /100 | #137 | Good 11.4% |
| Immigrants | England | 78.1 /100 | #138 | Good 11.5% |
| Immigrants | Indonesia | 77.6 /100 | #139 | Good 11.5% |
| Immigrants | Belgium | 77.5 /100 | #140 | Good 11.5% |
| Immigrants | Uruguay | 76.1 /100 | #141 | Good 11.5% |
| Immigrants | Korea | 75.1 /100 | #142 | Good 11.5% |
| Immigrants | Uganda | 74.5 /100 | #143 | Good 11.5% |
| Immigrants | Brazil | 74.3 /100 | #144 | Good 11.5% |
| Argentineans | 73.0 /100 | #145 | Good 11.5% |
| Brazilians | 72.5 /100 | #146 | Good 11.5% |
| Laotians | 72.4 /100 | #147 | Good 11.5% |
| Immigrants | Northern Europe | 72.1 /100 | #148 | Good 11.5% |
| Immigrants | Cambodia | 71.8 /100 | #149 | Good 11.5% |
Demographics Similar to Immigrants from Barbados by Unemployment Among Youth under 25 years
In terms of unemployment among youth under 25 years, the demographic groups most similar to Immigrants from Barbados are British West Indian (15.5%, a difference of 2.1%), Immigrants from Dominican Republic (15.6%, a difference of 2.2%), Alaska Native (14.9%, a difference of 2.2%), Immigrants from Yemen (15.6%, a difference of 2.3%), and Yakama (15.6%, a difference of 2.3%).
| Demographics | Rating | Rank | Unemployment Among Youth under 25 years |
| West Indians | 0.0 /100 | #319 | Tragic 14.6% |
| Barbadians | 0.0 /100 | #320 | Tragic 14.6% |
| Cheyenne | 0.0 /100 | #321 | Tragic 14.6% |
| Trinidadians and Tobagonians | 0.0 /100 | #322 | Tragic 14.6% |
| Immigrants | Trinidad and Tobago | 0.0 /100 | #323 | Tragic 14.6% |
| Immigrants | Jamaica | 0.0 /100 | #324 | Tragic 14.8% |
| Alaska Natives | 0.0 /100 | #325 | Tragic 14.9% |
| Immigrants | Barbados | 0.0 /100 | #326 | Tragic 15.2% |
| British West Indians | 0.0 /100 | #327 | Tragic 15.5% |
| Immigrants | Dominican Republic | 0.0 /100 | #328 | Tragic 15.6% |
| Immigrants | Yemen | 0.0 /100 | #329 | Tragic 15.6% |
| Yakama | 0.0 /100 | #330 | Tragic 15.6% |
| Dominicans | 0.0 /100 | #331 | Tragic 15.7% |
| Immigrants | Grenada | 0.0 /100 | #332 | Tragic 15.8% |
| Guyanese | 0.0 /100 | #333 | Tragic 15.9% |