Trinidadian and Tobagonian vs Portuguese Unemployment
COMPARE
Trinidadian and Tobagonian
Portuguese
Unemployment
Unemployment Comparison
Trinidadians and Tobagonians
Portuguese
6.3%
UNEMPLOYMENT
0.0/ 100
METRIC RATING
301st/ 347
METRIC RANK
5.4%
UNEMPLOYMENT
19.0/ 100
METRIC RATING
208th/ 347
METRIC RANK
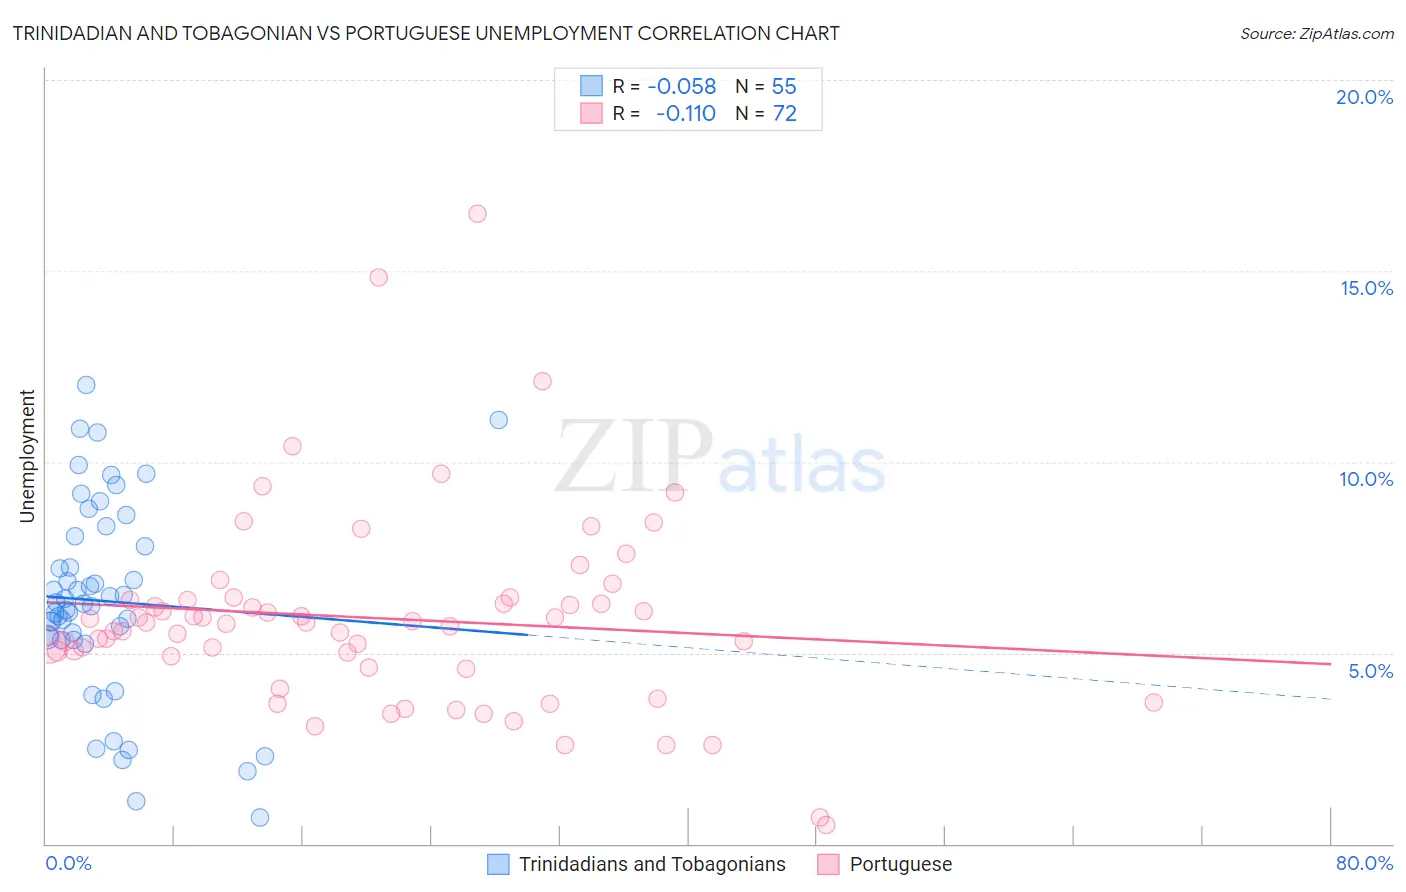
Trinidadian and Tobagonian vs Portuguese Unemployment Correlation Chart
The statistical analysis conducted on geographies consisting of 219,752,630 people shows a slight negative correlation between the proportion of Trinidadians and Tobagonians and unemployment in the United States with a correlation coefficient (R) of -0.058 and weighted average of 6.3%. Similarly, the statistical analysis conducted on geographies consisting of 449,464,903 people shows a poor negative correlation between the proportion of Portuguese and unemployment in the United States with a correlation coefficient (R) of -0.110 and weighted average of 5.4%, a difference of 18.1%.
Unemployment Correlation Summary
| Measurement | Trinidadian and Tobagonian | Portuguese |
| Minimum | 0.70% | 0.50% |
| Maximum | 12.0% | 16.5% |
| Range | 11.3% | 16.0% |
| Mean | 6.4% | 5.9% |
| Median | 6.3% | 5.8% |
| Interquartile 25% (IQ1) | 5.3% | 4.8% |
| Interquartile 75% (IQ3) | 8.1% | 6.4% |
| Interquartile Range (IQR) | 2.7% | 1.6% |
| Standard Deviation (Sample) | 2.6% | 2.6% |
| Standard Deviation (Population) | 2.6% | 2.6% |
Similar Demographics by Unemployment
Demographics Similar to Trinidadians and Tobagonians by Unemployment
In terms of unemployment, the demographic groups most similar to Trinidadians and Tobagonians are West Indian (6.4%, a difference of 0.25%), Immigrants from Trinidad and Tobago (6.3%, a difference of 0.48%), Belizean (6.4%, a difference of 0.48%), Immigrants from West Indies (6.3%, a difference of 0.60%), and Immigrants from Haiti (6.3%, a difference of 0.65%).
| Demographics | Rating | Rank | Unemployment |
| Spanish American Indians | 0.0 /100 | #294 | Tragic 6.2% |
| U.S. Virgin Islanders | 0.0 /100 | #295 | Tragic 6.3% |
| Ute | 0.0 /100 | #296 | Tragic 6.3% |
| Jamaicans | 0.0 /100 | #297 | Tragic 6.3% |
| Immigrants | Haiti | 0.0 /100 | #298 | Tragic 6.3% |
| Immigrants | West Indies | 0.0 /100 | #299 | Tragic 6.3% |
| Immigrants | Trinidad and Tobago | 0.0 /100 | #300 | Tragic 6.3% |
| Trinidadians and Tobagonians | 0.0 /100 | #301 | Tragic 6.3% |
| West Indians | 0.0 /100 | #302 | Tragic 6.4% |
| Belizeans | 0.0 /100 | #303 | Tragic 6.4% |
| Immigrants | Jamaica | 0.0 /100 | #304 | Tragic 6.4% |
| Menominee | 0.0 /100 | #305 | Tragic 6.4% |
| Lumbee | 0.0 /100 | #306 | Tragic 6.4% |
| Immigrants | Bangladesh | 0.0 /100 | #307 | Tragic 6.5% |
| Barbadians | 0.0 /100 | #308 | Tragic 6.5% |
Demographics Similar to Portuguese by Unemployment
In terms of unemployment, the demographic groups most similar to Portuguese are Creek (5.4%, a difference of 0.030%), Immigrants from Iran (5.4%, a difference of 0.030%), Immigrants from Iraq (5.4%, a difference of 0.050%), Iraqi (5.4%, a difference of 0.10%), and Ugandan (5.4%, a difference of 0.11%).
| Demographics | Rating | Rank | Unemployment |
| Immigrants | South Eastern Asia | 27.0 /100 | #201 | Fair 5.3% |
| Cherokee | 25.5 /100 | #202 | Fair 5.3% |
| Immigrants | Micronesia | 25.2 /100 | #203 | Fair 5.3% |
| Immigrants | Ukraine | 24.9 /100 | #204 | Fair 5.3% |
| Native Hawaiians | 24.1 /100 | #205 | Fair 5.3% |
| Immigrants | Peru | 22.7 /100 | #206 | Fair 5.4% |
| Creek | 19.4 /100 | #207 | Poor 5.4% |
| Portuguese | 19.0 /100 | #208 | Poor 5.4% |
| Immigrants | Iran | 18.8 /100 | #209 | Poor 5.4% |
| Immigrants | Iraq | 18.6 /100 | #210 | Poor 5.4% |
| Iraqis | 18.1 /100 | #211 | Poor 5.4% |
| Ugandans | 18.0 /100 | #212 | Poor 5.4% |
| Immigrants | Middle Africa | 15.3 /100 | #213 | Poor 5.4% |
| Immigrants | Costa Rica | 15.2 /100 | #214 | Poor 5.4% |
| Delaware | 14.7 /100 | #215 | Poor 5.4% |