Tongan vs Immigrants from Belize Male Unemployment
COMPARE
Tongan
Immigrants from Belize
Male Unemployment
Male Unemployment Comparison
Tongans
Immigrants from Belize
4.8%
MALE UNEMPLOYMENT
99.9/ 100
METRIC RATING
23rd/ 347
METRIC RANK
6.6%
MALE UNEMPLOYMENT
0.0/ 100
METRIC RATING
301st/ 347
METRIC RANK
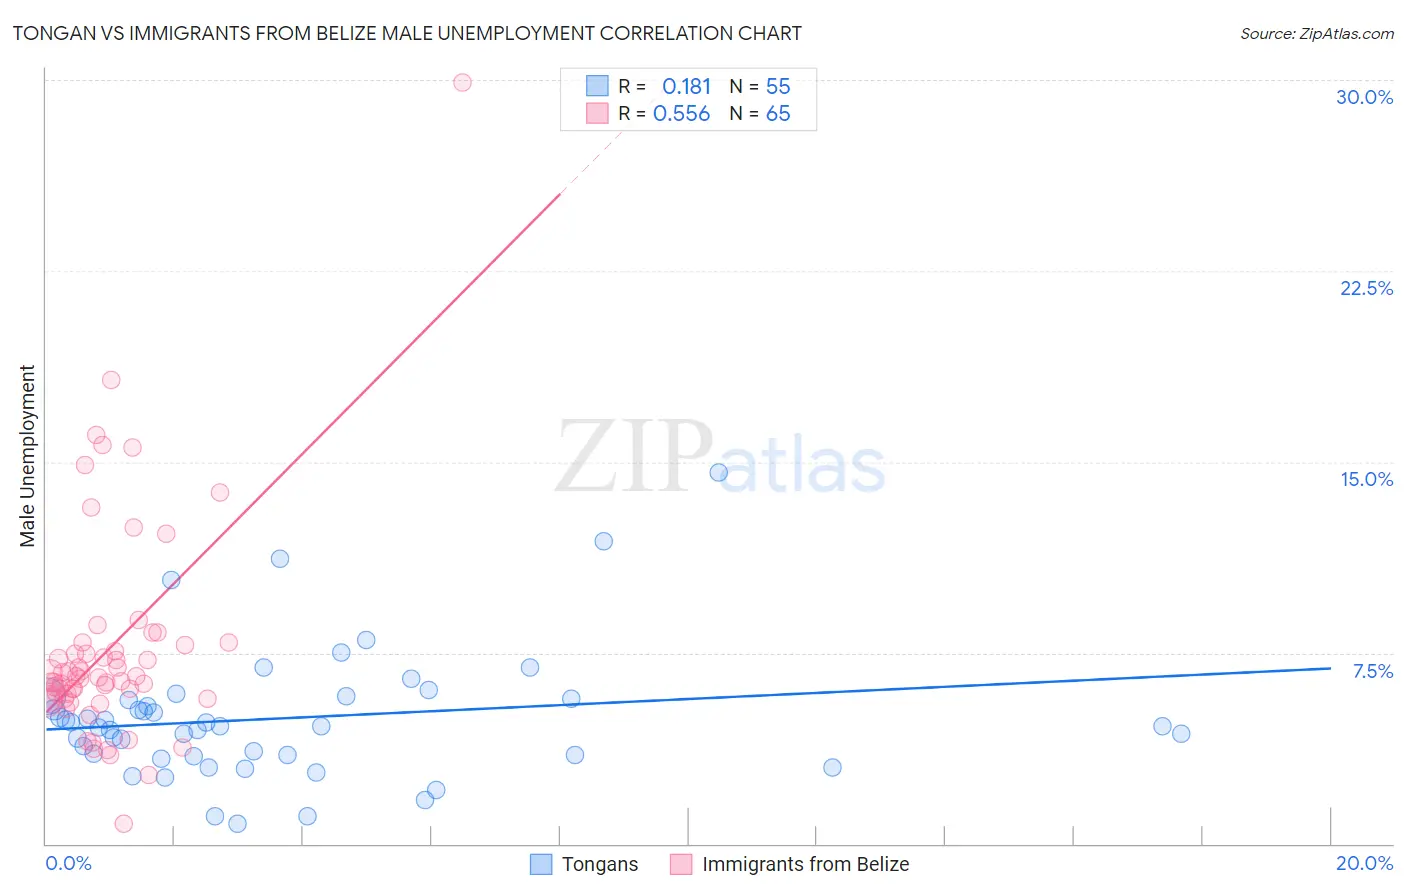
Tongan vs Immigrants from Belize Male Unemployment Correlation Chart
The statistical analysis conducted on geographies consisting of 102,801,849 people shows a poor positive correlation between the proportion of Tongans and unemployment rate among males in the United States with a correlation coefficient (R) of 0.181 and weighted average of 4.8%. Similarly, the statistical analysis conducted on geographies consisting of 130,217,625 people shows a substantial positive correlation between the proportion of Immigrants from Belize and unemployment rate among males in the United States with a correlation coefficient (R) of 0.556 and weighted average of 6.6%, a difference of 38.1%.
Male Unemployment Correlation Summary
| Measurement | Tongan | Immigrants from Belize |
| Minimum | 0.80% | 0.80% |
| Maximum | 14.6% | 29.9% |
| Range | 13.8% | 29.1% |
| Mean | 4.9% | 7.7% |
| Median | 4.6% | 6.5% |
| Interquartile 25% (IQ1) | 3.5% | 5.7% |
| Interquartile 75% (IQ3) | 5.7% | 7.9% |
| Interquartile Range (IQR) | 2.2% | 2.1% |
| Standard Deviation (Sample) | 2.5% | 4.4% |
| Standard Deviation (Population) | 2.5% | 4.3% |
Similar Demographics by Male Unemployment
Demographics Similar to Tongans by Male Unemployment
In terms of male unemployment, the demographic groups most similar to Tongans are Immigrants from South Central Asia (4.8%, a difference of 0.030%), Carpatho Rusyn (4.8%, a difference of 0.040%), Immigrants from Taiwan (4.8%, a difference of 0.060%), Zimbabwean (4.8%, a difference of 0.13%), and Dutch (4.8%, a difference of 0.15%).
| Demographics | Rating | Rank | Male Unemployment |
| Swiss | 99.9 /100 | #16 | Exceptional 4.7% |
| Filipinos | 99.9 /100 | #17 | Exceptional 4.7% |
| English | 99.9 /100 | #18 | Exceptional 4.8% |
| Europeans | 99.9 /100 | #19 | Exceptional 4.8% |
| Pennsylvania Germans | 99.9 /100 | #20 | Exceptional 4.8% |
| Immigrants | Taiwan | 99.9 /100 | #21 | Exceptional 4.8% |
| Carpatho Rusyns | 99.9 /100 | #22 | Exceptional 4.8% |
| Tongans | 99.9 /100 | #23 | Exceptional 4.8% |
| Immigrants | South Central Asia | 99.9 /100 | #24 | Exceptional 4.8% |
| Zimbabweans | 99.9 /100 | #25 | Exceptional 4.8% |
| Dutch | 99.9 /100 | #26 | Exceptional 4.8% |
| Belgians | 99.9 /100 | #27 | Exceptional 4.8% |
| Bulgarians | 99.8 /100 | #28 | Exceptional 4.8% |
| Scottish | 99.8 /100 | #29 | Exceptional 4.8% |
| British | 99.8 /100 | #30 | Exceptional 4.8% |
Demographics Similar to Immigrants from Belize by Male Unemployment
In terms of male unemployment, the demographic groups most similar to Immigrants from Belize are Vietnamese (6.6%, a difference of 0.11%), Immigrants from Bangladesh (6.6%, a difference of 0.38%), Jamaican (6.6%, a difference of 0.51%), Chippewa (6.6%, a difference of 0.58%), and Ute (6.6%, a difference of 0.71%).
| Demographics | Rating | Rank | Male Unemployment |
| Senegalese | 0.0 /100 | #294 | Tragic 6.4% |
| Belizeans | 0.0 /100 | #295 | Tragic 6.5% |
| Immigrants | Haiti | 0.0 /100 | #296 | Tragic 6.5% |
| Chippewa | 0.0 /100 | #297 | Tragic 6.6% |
| Jamaicans | 0.0 /100 | #298 | Tragic 6.6% |
| Immigrants | Bangladesh | 0.0 /100 | #299 | Tragic 6.6% |
| Vietnamese | 0.0 /100 | #300 | Tragic 6.6% |
| Immigrants | Belize | 0.0 /100 | #301 | Tragic 6.6% |
| Ute | 0.0 /100 | #302 | Tragic 6.6% |
| Immigrants | West Indies | 0.0 /100 | #303 | Tragic 6.7% |
| West Indians | 0.0 /100 | #304 | Tragic 6.7% |
| Trinidadians and Tobagonians | 0.0 /100 | #305 | Tragic 6.7% |
| Immigrants | Trinidad and Tobago | 0.0 /100 | #306 | Tragic 6.7% |
| Immigrants | Jamaica | 0.0 /100 | #307 | Tragic 6.7% |
| Aleuts | 0.0 /100 | #308 | Tragic 6.8% |