Slavic vs Immigrants from Somalia Unemployment Among Youth under 25 years
COMPARE
Slavic
Immigrants from Somalia
Unemployment Among Youth under 25 years
Unemployment Among Youth under 25 years Comparison
Slavs
Immigrants from Somalia
11.2%
UNEMPLOYMENT AMONG YOUTH UNDER 25 YEARS
97.5/ 100
METRIC RATING
70th/ 347
METRIC RANK
10.5%
UNEMPLOYMENT AMONG YOUTH UNDER 25 YEARS
100.0/ 100
METRIC RATING
10th/ 347
METRIC RANK
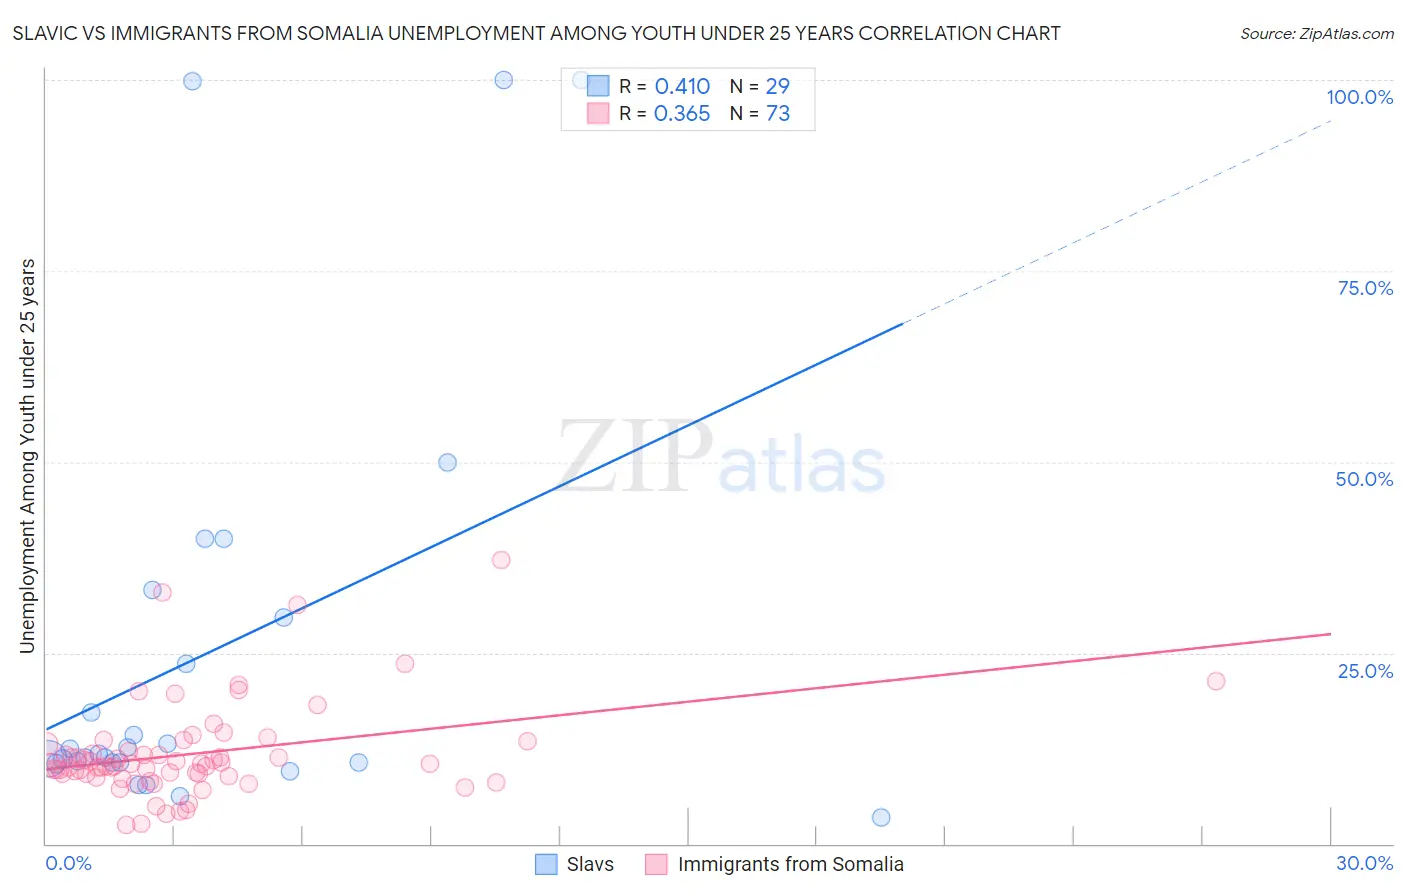
Slavic vs Immigrants from Somalia Unemployment Among Youth under 25 years Correlation Chart
The statistical analysis conducted on geographies consisting of 268,067,353 people shows a moderate positive correlation between the proportion of Slavs and unemployment rate among youth under the age of 25 in the United States with a correlation coefficient (R) of 0.410 and weighted average of 11.2%. Similarly, the statistical analysis conducted on geographies consisting of 91,963,358 people shows a mild positive correlation between the proportion of Immigrants from Somalia and unemployment rate among youth under the age of 25 in the United States with a correlation coefficient (R) of 0.365 and weighted average of 10.5%, a difference of 6.2%.
Unemployment Among Youth under 25 years Correlation Summary
| Measurement | Slavic | Immigrants from Somalia |
| Minimum | 3.5% | 2.5% |
| Maximum | 100.0% | 37.1% |
| Range | 96.5% | 34.6% |
| Mean | 25.2% | 11.8% |
| Median | 11.8% | 10.4% |
| Interquartile 25% (IQ1) | 10.7% | 9.0% |
| Interquartile 75% (IQ3) | 31.4% | 12.6% |
| Interquartile Range (IQR) | 20.7% | 3.5% |
| Standard Deviation (Sample) | 28.2% | 6.2% |
| Standard Deviation (Population) | 27.7% | 6.1% |
Similar Demographics by Unemployment Among Youth under 25 years
Demographics Similar to Slavs by Unemployment Among Youth under 25 years
In terms of unemployment among youth under 25 years, the demographic groups most similar to Slavs are Immigrants from Moldova (11.2%, a difference of 0.010%), Bhutanese (11.2%, a difference of 0.040%), Immigrants from Kenya (11.2%, a difference of 0.050%), Chickasaw (11.2%, a difference of 0.070%), and Immigrants from Australia (11.2%, a difference of 0.080%).
| Demographics | Rating | Rank | Unemployment Among Youth under 25 years |
| Immigrants | Croatia | 98.1 /100 | #63 | Exceptional 11.1% |
| Jordanians | 97.9 /100 | #64 | Exceptional 11.1% |
| Immigrants | Singapore | 97.8 /100 | #65 | Exceptional 11.2% |
| Macedonians | 97.7 /100 | #66 | Exceptional 11.2% |
| Chickasaw | 97.7 /100 | #67 | Exceptional 11.2% |
| Immigrants | Kenya | 97.6 /100 | #68 | Exceptional 11.2% |
| Immigrants | Moldova | 97.5 /100 | #69 | Exceptional 11.2% |
| Slavs | 97.5 /100 | #70 | Exceptional 11.2% |
| Bhutanese | 97.4 /100 | #71 | Exceptional 11.2% |
| Immigrants | Australia | 97.3 /100 | #72 | Exceptional 11.2% |
| Creek | 97.2 /100 | #73 | Exceptional 11.2% |
| New Zealanders | 97.2 /100 | #74 | Exceptional 11.2% |
| French | 97.1 /100 | #75 | Exceptional 11.2% |
| German Russians | 97.0 /100 | #76 | Exceptional 11.2% |
| Whites/Caucasians | 96.9 /100 | #77 | Exceptional 11.2% |
Demographics Similar to Immigrants from Somalia by Unemployment Among Youth under 25 years
In terms of unemployment among youth under 25 years, the demographic groups most similar to Immigrants from Somalia are German (10.5%, a difference of 0.020%), Scandinavian (10.5%, a difference of 0.13%), Immigrants from Sudan (10.5%, a difference of 0.31%), Immigrants from Venezuela (10.5%, a difference of 0.42%), and Indonesian (10.6%, a difference of 0.43%).
| Demographics | Rating | Rank | Unemployment Among Youth under 25 years |
| Luxembourgers | 100.0 /100 | #3 | Exceptional 10.0% |
| Zimbabweans | 100.0 /100 | #4 | Exceptional 10.2% |
| Czechs | 100.0 /100 | #5 | Exceptional 10.3% |
| Danes | 100.0 /100 | #6 | Exceptional 10.3% |
| Swedes | 100.0 /100 | #7 | Exceptional 10.4% |
| Immigrants | Venezuela | 100.0 /100 | #8 | Exceptional 10.5% |
| Germans | 100.0 /100 | #9 | Exceptional 10.5% |
| Immigrants | Somalia | 100.0 /100 | #10 | Exceptional 10.5% |
| Scandinavians | 100.0 /100 | #11 | Exceptional 10.5% |
| Immigrants | Sudan | 100.0 /100 | #12 | Exceptional 10.5% |
| Indonesians | 100.0 /100 | #13 | Exceptional 10.6% |
| Cubans | 100.0 /100 | #14 | Exceptional 10.6% |
| Sudanese | 100.0 /100 | #15 | Exceptional 10.6% |
| Venezuelans | 100.0 /100 | #16 | Exceptional 10.6% |
| Menominee | 100.0 /100 | #17 | Exceptional 10.6% |