Tongan vs Guatemalan Unemployment Among Women with Children Under 18 years
COMPARE
Tongan
Guatemalan
Unemployment Among Women with Children Under 18 years
Unemployment Among Women with Children Under 18 years Comparison
Tongans
Guatemalans
4.7%
UNEMPLOYMENT AMONG WOMEN WITH CHILDREN UNDER 18 YEARS
100.0/ 100
METRIC RATING
5th/ 347
METRIC RANK
6.3%
UNEMPLOYMENT AMONG WOMEN WITH CHILDREN UNDER 18 YEARS
0.0/ 100
METRIC RATING
280th/ 347
METRIC RANK
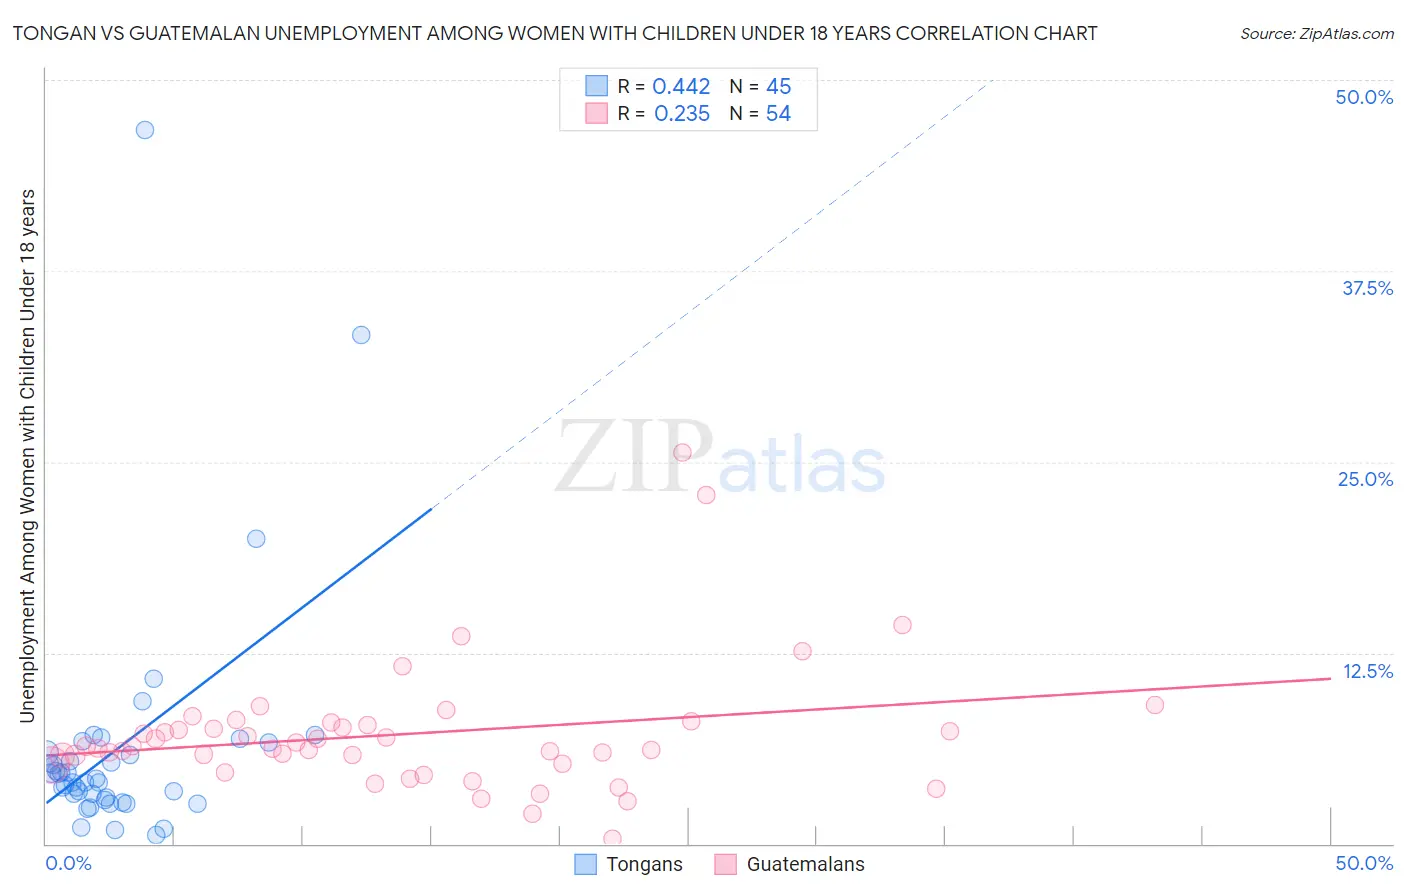
Tongan vs Guatemalan Unemployment Among Women with Children Under 18 years Correlation Chart
The statistical analysis conducted on geographies consisting of 101,502,527 people shows a moderate positive correlation between the proportion of Tongans and unemployment rate among women with children under the age of 18 in the United States with a correlation coefficient (R) of 0.442 and weighted average of 4.7%. Similarly, the statistical analysis conducted on geographies consisting of 395,043,654 people shows a weak positive correlation between the proportion of Guatemalans and unemployment rate among women with children under the age of 18 in the United States with a correlation coefficient (R) of 0.235 and weighted average of 6.3%, a difference of 34.9%.
Unemployment Among Women with Children Under 18 years Correlation Summary
| Measurement | Tongan | Guatemalan |
| Minimum | 0.60% | 0.30% |
| Maximum | 46.7% | 25.6% |
| Range | 46.1% | 25.3% |
| Mean | 6.3% | 7.2% |
| Median | 4.2% | 6.3% |
| Interquartile 25% (IQ1) | 2.9% | 5.2% |
| Interquartile 75% (IQ3) | 6.3% | 7.8% |
| Interquartile Range (IQR) | 3.3% | 2.6% |
| Standard Deviation (Sample) | 8.1% | 4.3% |
| Standard Deviation (Population) | 8.0% | 4.2% |
Similar Demographics by Unemployment Among Women with Children Under 18 years
Demographics Similar to Tongans by Unemployment Among Women with Children Under 18 years
In terms of unemployment among women with children under 18 years, the demographic groups most similar to Tongans are Swedish (4.7%, a difference of 0.050%), Immigrants from Taiwan (4.7%, a difference of 0.11%), Immigrants from India (4.7%, a difference of 0.22%), Immigrants from Hong Kong (4.7%, a difference of 0.63%), and Okinawan (4.7%, a difference of 1.5%).
| Demographics | Rating | Rank | Unemployment Among Women with Children Under 18 years |
| Norwegians | 100.0 /100 | #1 | Exceptional 4.4% |
| Hmong | 100.0 /100 | #2 | Exceptional 4.5% |
| Danes | 100.0 /100 | #3 | Exceptional 4.5% |
| Swedes | 100.0 /100 | #4 | Exceptional 4.7% |
| Tongans | 100.0 /100 | #5 | Exceptional 4.7% |
| Immigrants | Taiwan | 100.0 /100 | #6 | Exceptional 4.7% |
| Immigrants | India | 100.0 /100 | #7 | Exceptional 4.7% |
| Immigrants | Hong Kong | 100.0 /100 | #8 | Exceptional 4.7% |
| Okinawans | 99.9 /100 | #9 | Exceptional 4.7% |
| Czechs | 99.9 /100 | #10 | Exceptional 4.7% |
| Filipinos | 99.9 /100 | #11 | Exceptional 4.8% |
| Scandinavians | 99.9 /100 | #12 | Exceptional 4.8% |
| Bulgarians | 99.9 /100 | #13 | Exceptional 4.8% |
| Cambodians | 99.9 /100 | #14 | Exceptional 4.8% |
| Thais | 99.8 /100 | #15 | Exceptional 4.8% |
Demographics Similar to Guatemalans by Unemployment Among Women with Children Under 18 years
In terms of unemployment among women with children under 18 years, the demographic groups most similar to Guatemalans are Immigrants from El Salvador (6.3%, a difference of 0.16%), Immigrants from St. Vincent and the Grenadines (6.3%, a difference of 0.17%), West Indian (6.3%, a difference of 0.36%), Immigrants from Grenada (6.3%, a difference of 0.39%), and Immigrants from Portugal (6.3%, a difference of 0.50%).
| Demographics | Rating | Rank | Unemployment Among Women with Children Under 18 years |
| Immigrants | Western Africa | 0.0 /100 | #273 | Tragic 6.2% |
| Senegalese | 0.0 /100 | #274 | Tragic 6.2% |
| Dutch West Indians | 0.0 /100 | #275 | Tragic 6.2% |
| Immigrants | Ghana | 0.0 /100 | #276 | Tragic 6.2% |
| Mexican American Indians | 0.0 /100 | #277 | Tragic 6.2% |
| Immigrants | Barbados | 0.0 /100 | #278 | Tragic 6.2% |
| Immigrants | Portugal | 0.0 /100 | #279 | Tragic 6.3% |
| Guatemalans | 0.0 /100 | #280 | Tragic 6.3% |
| Immigrants | El Salvador | 0.0 /100 | #281 | Tragic 6.3% |
| Immigrants | St. Vincent and the Grenadines | 0.0 /100 | #282 | Tragic 6.3% |
| West Indians | 0.0 /100 | #283 | Tragic 6.3% |
| Immigrants | Grenada | 0.0 /100 | #284 | Tragic 6.3% |
| Bahamians | 0.0 /100 | #285 | Tragic 6.3% |
| Alaskan Athabascans | 0.0 /100 | #286 | Tragic 6.3% |
| Kiowa | 0.0 /100 | #287 | Tragic 6.3% |