Tongan vs Bangladeshi Unemployment Among Women with Children Under 18 years
COMPARE
Tongan
Bangladeshi
Unemployment Among Women with Children Under 18 years
Unemployment Among Women with Children Under 18 years Comparison
Tongans
Bangladeshis
4.7%
UNEMPLOYMENT AMONG WOMEN WITH CHILDREN UNDER 18 YEARS
100.0/ 100
METRIC RATING
5th/ 347
METRIC RANK
5.3%
UNEMPLOYMENT AMONG WOMEN WITH CHILDREN UNDER 18 YEARS
73.2/ 100
METRIC RATING
147th/ 347
METRIC RANK
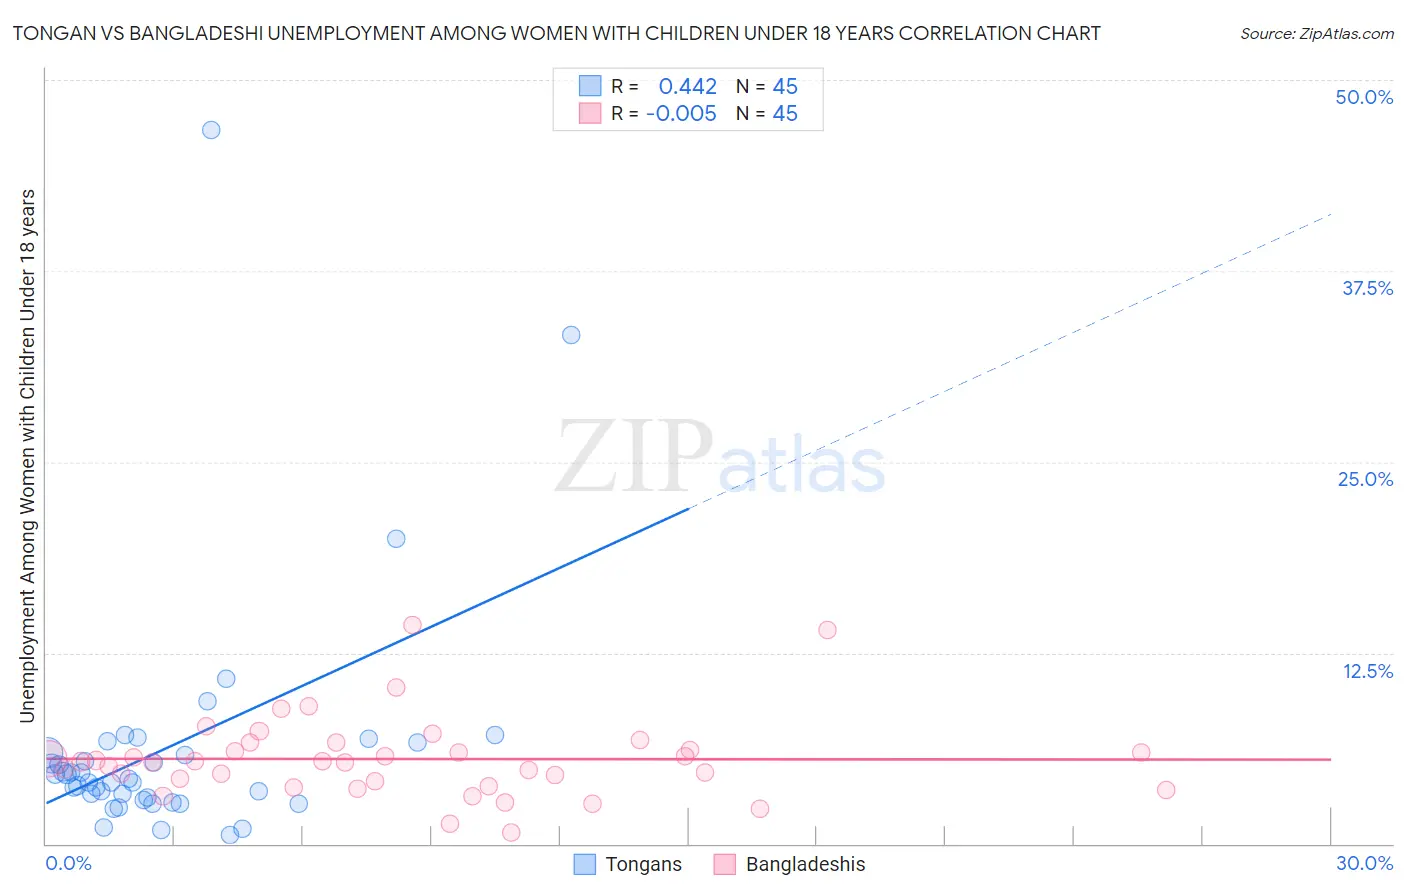
Tongan vs Bangladeshi Unemployment Among Women with Children Under 18 years Correlation Chart
The statistical analysis conducted on geographies consisting of 101,502,527 people shows a moderate positive correlation between the proportion of Tongans and unemployment rate among women with children under the age of 18 in the United States with a correlation coefficient (R) of 0.442 and weighted average of 4.7%. Similarly, the statistical analysis conducted on geographies consisting of 138,843,542 people shows no correlation between the proportion of Bangladeshis and unemployment rate among women with children under the age of 18 in the United States with a correlation coefficient (R) of -0.005 and weighted average of 5.3%, a difference of 14.8%.
Unemployment Among Women with Children Under 18 years Correlation Summary
| Measurement | Tongan | Bangladeshi |
| Minimum | 0.60% | 0.70% |
| Maximum | 46.7% | 14.4% |
| Range | 46.1% | 13.7% |
| Mean | 6.3% | 5.5% |
| Median | 4.2% | 5.4% |
| Interquartile 25% (IQ1) | 2.9% | 3.9% |
| Interquartile 75% (IQ3) | 6.3% | 6.4% |
| Interquartile Range (IQR) | 3.3% | 2.4% |
| Standard Deviation (Sample) | 8.1% | 2.7% |
| Standard Deviation (Population) | 8.0% | 2.6% |
Similar Demographics by Unemployment Among Women with Children Under 18 years
Demographics Similar to Tongans by Unemployment Among Women with Children Under 18 years
In terms of unemployment among women with children under 18 years, the demographic groups most similar to Tongans are Swedish (4.7%, a difference of 0.050%), Immigrants from Taiwan (4.7%, a difference of 0.11%), Immigrants from India (4.7%, a difference of 0.22%), Immigrants from Hong Kong (4.7%, a difference of 0.63%), and Okinawan (4.7%, a difference of 1.5%).
| Demographics | Rating | Rank | Unemployment Among Women with Children Under 18 years |
| Norwegians | 100.0 /100 | #1 | Exceptional 4.4% |
| Hmong | 100.0 /100 | #2 | Exceptional 4.5% |
| Danes | 100.0 /100 | #3 | Exceptional 4.5% |
| Swedes | 100.0 /100 | #4 | Exceptional 4.7% |
| Tongans | 100.0 /100 | #5 | Exceptional 4.7% |
| Immigrants | Taiwan | 100.0 /100 | #6 | Exceptional 4.7% |
| Immigrants | India | 100.0 /100 | #7 | Exceptional 4.7% |
| Immigrants | Hong Kong | 100.0 /100 | #8 | Exceptional 4.7% |
| Okinawans | 99.9 /100 | #9 | Exceptional 4.7% |
| Czechs | 99.9 /100 | #10 | Exceptional 4.7% |
| Filipinos | 99.9 /100 | #11 | Exceptional 4.8% |
| Scandinavians | 99.9 /100 | #12 | Exceptional 4.8% |
| Bulgarians | 99.9 /100 | #13 | Exceptional 4.8% |
| Cambodians | 99.9 /100 | #14 | Exceptional 4.8% |
| Thais | 99.8 /100 | #15 | Exceptional 4.8% |
Demographics Similar to Bangladeshis by Unemployment Among Women with Children Under 18 years
In terms of unemployment among women with children under 18 years, the demographic groups most similar to Bangladeshis are Immigrants from Belarus (5.3%, a difference of 0.020%), Immigrants from Western Europe (5.4%, a difference of 0.030%), Immigrants from Egypt (5.3%, a difference of 0.070%), Immigrants from Kenya (5.4%, a difference of 0.090%), and Immigrants from Argentina (5.4%, a difference of 0.13%).
| Demographics | Rating | Rank | Unemployment Among Women with Children Under 18 years |
| Immigrants | Norway | 76.2 /100 | #140 | Good 5.3% |
| Venezuelans | 76.0 /100 | #141 | Good 5.3% |
| Immigrants | Venezuela | 75.4 /100 | #142 | Good 5.3% |
| Chileans | 75.0 /100 | #143 | Good 5.3% |
| Immigrants | England | 74.9 /100 | #144 | Good 5.3% |
| Immigrants | Egypt | 74.0 /100 | #145 | Good 5.3% |
| Immigrants | Belarus | 73.4 /100 | #146 | Good 5.3% |
| Bangladeshis | 73.2 /100 | #147 | Good 5.3% |
| Immigrants | Western Europe | 72.8 /100 | #148 | Good 5.4% |
| Immigrants | Kenya | 72.2 /100 | #149 | Good 5.4% |
| Immigrants | Argentina | 71.7 /100 | #150 | Good 5.4% |
| Immigrants | Iran | 71.1 /100 | #151 | Good 5.4% |
| Immigrants | South Eastern Asia | 71.1 /100 | #152 | Good 5.4% |
| Carpatho Rusyns | 70.8 /100 | #153 | Good 5.4% |
| Immigrants | Latvia | 70.8 /100 | #154 | Good 5.4% |