Immigrants from Italy vs Bangladeshi Unemployment Among Women with Children Under 18 years
COMPARE
Immigrants from Italy
Bangladeshi
Unemployment Among Women with Children Under 18 years
Unemployment Among Women with Children Under 18 years Comparison
Immigrants from Italy
Bangladeshis
5.3%
UNEMPLOYMENT AMONG WOMEN WITH CHILDREN UNDER 18 YEARS
82.3/ 100
METRIC RATING
129th/ 347
METRIC RANK
5.3%
UNEMPLOYMENT AMONG WOMEN WITH CHILDREN UNDER 18 YEARS
73.2/ 100
METRIC RATING
147th/ 347
METRIC RANK
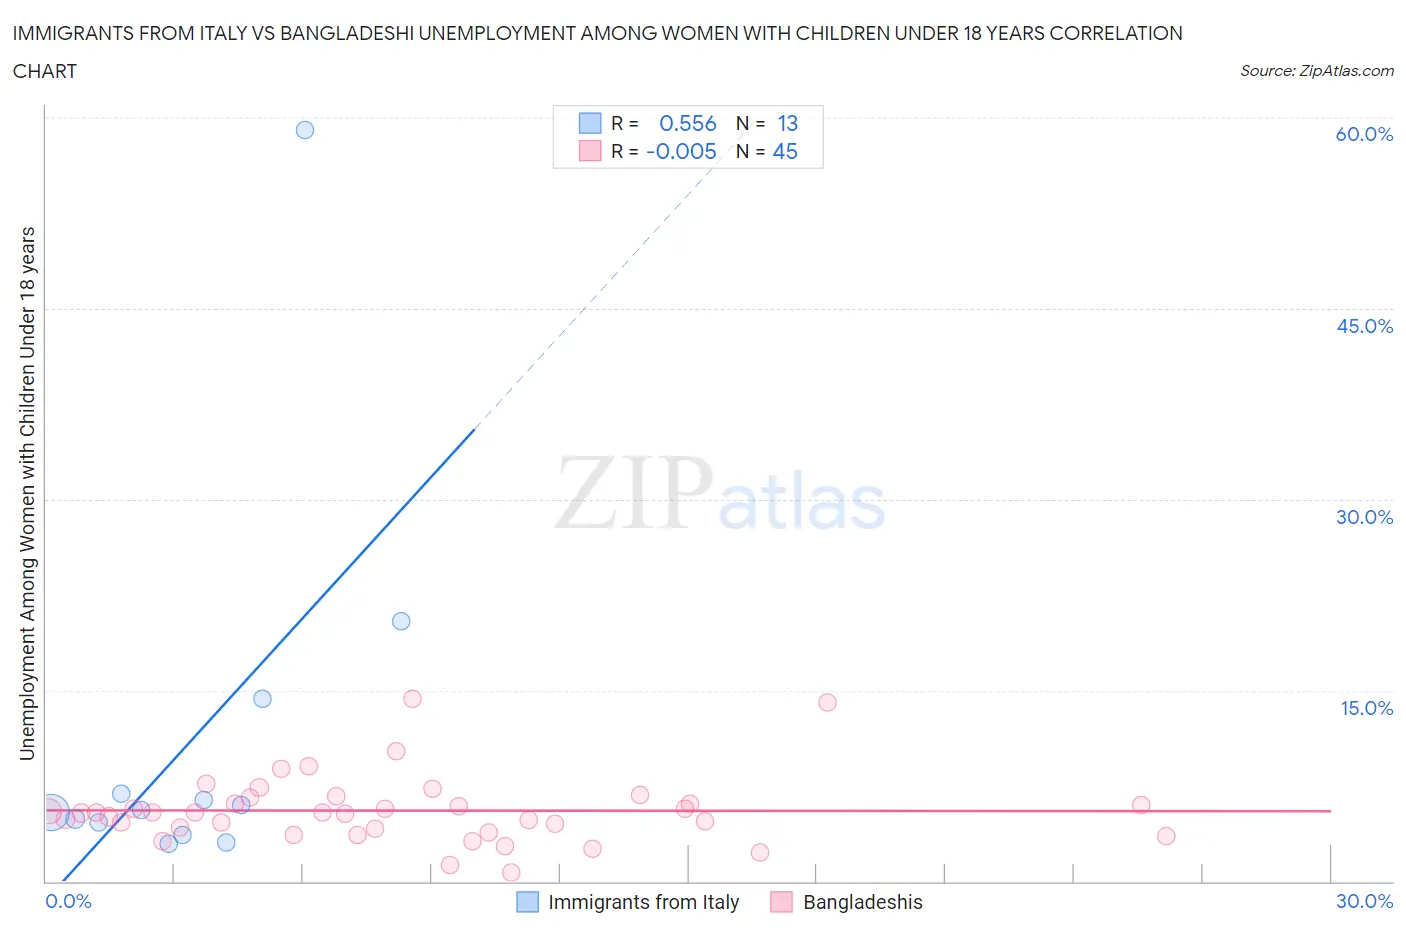
Immigrants from Italy vs Bangladeshi Unemployment Among Women with Children Under 18 years Correlation Chart
The statistical analysis conducted on geographies consisting of 312,548,570 people shows a substantial positive correlation between the proportion of Immigrants from Italy and unemployment rate among women with children under the age of 18 in the United States with a correlation coefficient (R) of 0.556 and weighted average of 5.3%. Similarly, the statistical analysis conducted on geographies consisting of 138,843,542 people shows no correlation between the proportion of Bangladeshis and unemployment rate among women with children under the age of 18 in the United States with a correlation coefficient (R) of -0.005 and weighted average of 5.3%, a difference of 0.98%.
Unemployment Among Women with Children Under 18 years Correlation Summary
| Measurement | Immigrants from Italy | Bangladeshi |
| Minimum | 2.9% | 0.70% |
| Maximum | 59.0% | 14.4% |
| Range | 56.1% | 13.7% |
| Mean | 11.0% | 5.5% |
| Median | 5.6% | 5.4% |
| Interquartile 25% (IQ1) | 4.1% | 3.9% |
| Interquartile 75% (IQ3) | 10.6% | 6.4% |
| Interquartile Range (IQR) | 6.5% | 2.4% |
| Standard Deviation (Sample) | 15.2% | 2.7% |
| Standard Deviation (Population) | 14.6% | 2.6% |
Demographics Similar to Immigrants from Italy and Bangladeshis by Unemployment Among Women with Children Under 18 years
In terms of unemployment among women with children under 18 years, the demographic groups most similar to Immigrants from Italy are Immigrants from Austria (5.3%, a difference of 0.030%), Immigrants from South Africa (5.3%, a difference of 0.050%), Immigrants from Israel (5.3%, a difference of 0.050%), Immigrants from Ethiopia (5.3%, a difference of 0.12%), and Ethiopian (5.3%, a difference of 0.20%). Similarly, the demographic groups most similar to Bangladeshis are Immigrants from Belarus (5.3%, a difference of 0.020%), Immigrants from Western Europe (5.4%, a difference of 0.030%), Immigrants from Egypt (5.3%, a difference of 0.070%), Immigrants from England (5.3%, a difference of 0.16%), and Chilean (5.3%, a difference of 0.17%).
| Demographics | Rating | Rank | Unemployment Among Women with Children Under 18 years |
| Immigrants | South Africa | 82.8 /100 | #128 | Excellent 5.3% |
| Immigrants | Italy | 82.3 /100 | #129 | Excellent 5.3% |
| Immigrants | Austria | 82.1 /100 | #130 | Excellent 5.3% |
| Immigrants | Israel | 81.9 /100 | #131 | Excellent 5.3% |
| Immigrants | Ethiopia | 81.4 /100 | #132 | Excellent 5.3% |
| Ethiopians | 80.7 /100 | #133 | Excellent 5.3% |
| Slovaks | 80.5 /100 | #134 | Excellent 5.3% |
| New Zealanders | 79.9 /100 | #135 | Good 5.3% |
| Immigrants | Jordan | 79.5 /100 | #136 | Good 5.3% |
| Jordanians | 78.8 /100 | #137 | Good 5.3% |
| Argentineans | 78.8 /100 | #138 | Good 5.3% |
| Immigrants | Ukraine | 78.5 /100 | #139 | Good 5.3% |
| Immigrants | Norway | 76.2 /100 | #140 | Good 5.3% |
| Venezuelans | 76.0 /100 | #141 | Good 5.3% |
| Immigrants | Venezuela | 75.4 /100 | #142 | Good 5.3% |
| Chileans | 75.0 /100 | #143 | Good 5.3% |
| Immigrants | England | 74.9 /100 | #144 | Good 5.3% |
| Immigrants | Egypt | 74.0 /100 | #145 | Good 5.3% |
| Immigrants | Belarus | 73.4 /100 | #146 | Good 5.3% |
| Bangladeshis | 73.2 /100 | #147 | Good 5.3% |
| Immigrants | Western Europe | 72.8 /100 | #148 | Good 5.4% |