Immigrants from Australia vs Nonimmigrants Unemployment
COMPARE
Immigrants from Australia
Nonimmigrants
Unemployment
Unemployment Comparison
Immigrants from Australia
Nonimmigrants
5.0%
UNEMPLOYMENT
97.0/ 100
METRIC RATING
85th/ 347
METRIC RANK
5.3%
UNEMPLOYMENT
47.9/ 100
METRIC RATING
177th/ 347
METRIC RANK
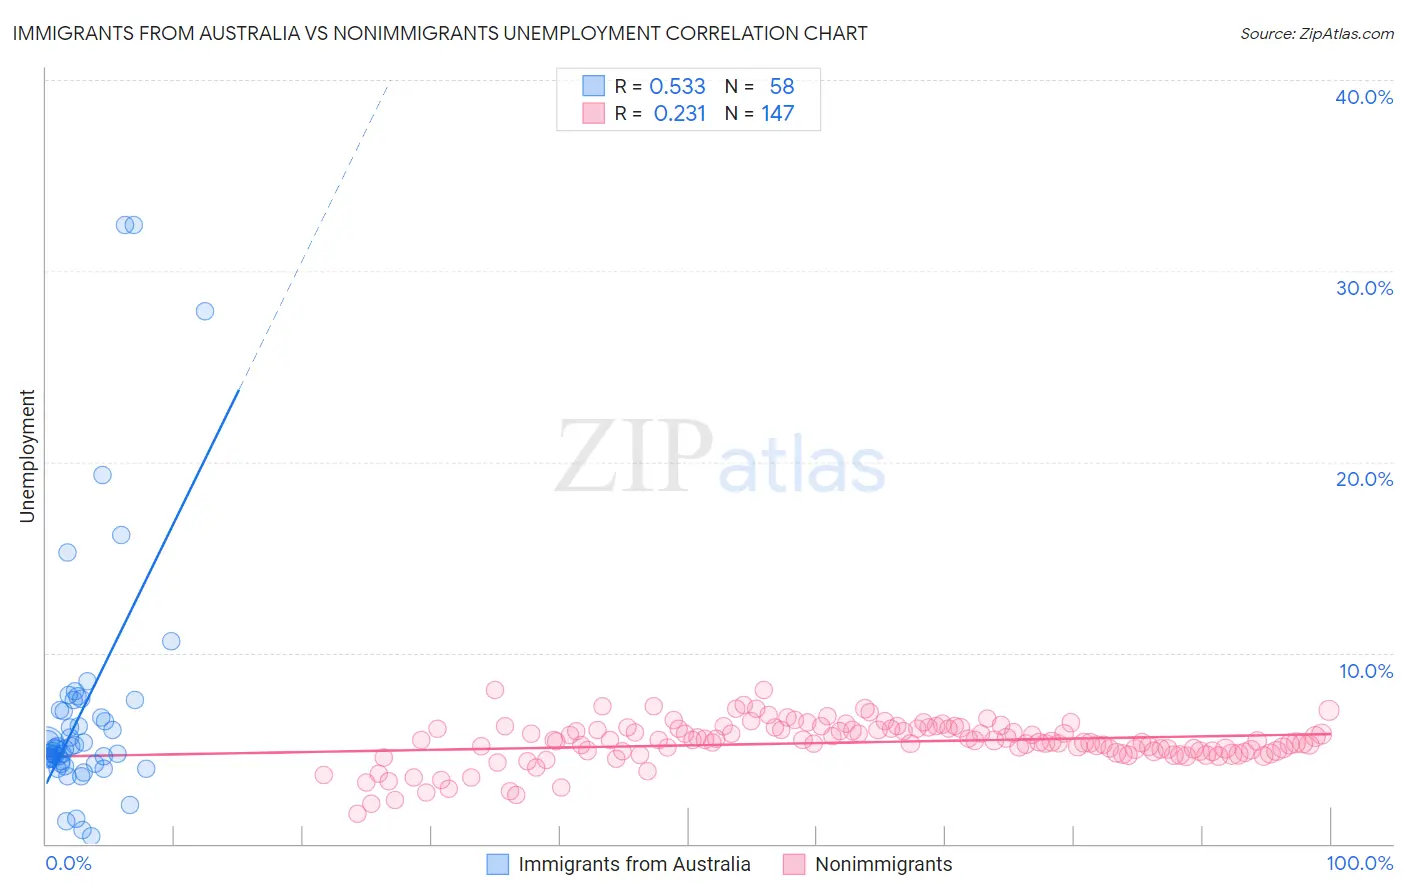
Immigrants from Australia vs Nonimmigrants Unemployment Correlation Chart
The statistical analysis conducted on geographies consisting of 227,110,462 people shows a substantial positive correlation between the proportion of Immigrants from Australia and unemployment in the United States with a correlation coefficient (R) of 0.533 and weighted average of 5.0%. Similarly, the statistical analysis conducted on geographies consisting of 578,965,270 people shows a weak positive correlation between the proportion of Nonimmigrants and unemployment in the United States with a correlation coefficient (R) of 0.231 and weighted average of 5.3%, a difference of 5.8%.
Unemployment Correlation Summary
| Measurement | Immigrants from Australia | Nonimmigrants |
| Minimum | 0.40% | 1.6% |
| Maximum | 32.4% | 8.1% |
| Range | 32.0% | 6.5% |
| Mean | 7.0% | 5.3% |
| Median | 5.0% | 5.4% |
| Interquartile 25% (IQ1) | 4.3% | 4.8% |
| Interquartile 75% (IQ3) | 7.0% | 6.0% |
| Interquartile Range (IQR) | 2.7% | 1.2% |
| Standard Deviation (Sample) | 6.5% | 1.1% |
| Standard Deviation (Population) | 6.5% | 1.1% |
Similar Demographics by Unemployment
Demographics Similar to Immigrants from Australia by Unemployment
In terms of unemployment, the demographic groups most similar to Immigrants from Australia are Hungarian (5.0%, a difference of 0.030%), Immigrants from Moldova (5.0%, a difference of 0.18%), Immigrants from Korea (5.0%, a difference of 0.21%), Russian (5.0%, a difference of 0.28%), and Jordanian (5.0%, a difference of 0.30%).
| Demographics | Rating | Rank | Unemployment |
| Okinawans | 97.9 /100 | #78 | Exceptional 4.9% |
| Canadians | 97.7 /100 | #79 | Exceptional 5.0% |
| Immigrants | Sweden | 97.6 /100 | #80 | Exceptional 5.0% |
| Basques | 97.6 /100 | #81 | Exceptional 5.0% |
| Fijians | 97.6 /100 | #82 | Exceptional 5.0% |
| Hmong | 97.6 /100 | #83 | Exceptional 5.0% |
| Russians | 97.4 /100 | #84 | Exceptional 5.0% |
| Immigrants | Australia | 97.0 /100 | #85 | Exceptional 5.0% |
| Hungarians | 96.9 /100 | #86 | Exceptional 5.0% |
| Immigrants | Moldova | 96.6 /100 | #87 | Exceptional 5.0% |
| Immigrants | Korea | 96.6 /100 | #88 | Exceptional 5.0% |
| Jordanians | 96.4 /100 | #89 | Exceptional 5.0% |
| Immigrants | North Macedonia | 96.3 /100 | #90 | Exceptional 5.0% |
| Immigrants | Sudan | 96.3 /100 | #91 | Exceptional 5.0% |
| Immigrants | South Africa | 96.2 /100 | #92 | Exceptional 5.0% |
Demographics Similar to Nonimmigrants by Unemployment
In terms of unemployment, the demographic groups most similar to Nonimmigrants are Afghan (5.3%, a difference of 0.030%), Nicaraguan (5.3%, a difference of 0.050%), Malaysian (5.3%, a difference of 0.060%), Taiwanese (5.3%, a difference of 0.11%), and Immigrants from Congo (5.3%, a difference of 0.13%).
| Demographics | Rating | Rank | Unemployment |
| Immigrants | Nicaragua | 57.1 /100 | #170 | Average 5.2% |
| Puget Sound Salish | 56.6 /100 | #171 | Average 5.2% |
| Immigrants | Vietnam | 52.5 /100 | #172 | Average 5.2% |
| Immigrants | Poland | 51.8 /100 | #173 | Average 5.3% |
| Immigrants | Congo | 50.0 /100 | #174 | Average 5.3% |
| Taiwanese | 49.6 /100 | #175 | Average 5.3% |
| Nicaraguans | 48.7 /100 | #176 | Average 5.3% |
| Immigrants | Nonimmigrants | 47.9 /100 | #177 | Average 5.3% |
| Afghans | 47.4 /100 | #178 | Average 5.3% |
| Malaysians | 46.8 /100 | #179 | Average 5.3% |
| Immigrants | Greece | 45.0 /100 | #180 | Average 5.3% |
| Albanians | 43.5 /100 | #181 | Average 5.3% |
| Spaniards | 42.2 /100 | #182 | Average 5.3% |
| Brazilians | 40.2 /100 | #183 | Average 5.3% |
| Assyrians/Chaldeans/Syriacs | 39.2 /100 | #184 | Fair 5.3% |