Tohono O'odham vs Immigrants from Ghana Unemployment Among Ages 25 to 29 years
COMPARE
Tohono O'odham
Immigrants from Ghana
Unemployment Among Ages 25 to 29 years
Unemployment Among Ages 25 to 29 years Comparison
Tohono O'odham
Immigrants from Ghana
12.1%
UNEMPLOYMENT AMONG AGES 25 TO 29 YEARS
0.0/ 100
METRIC RATING
341st/ 347
METRIC RANK
7.5%
UNEMPLOYMENT AMONG AGES 25 TO 29 YEARS
0.0/ 100
METRIC RATING
275th/ 347
METRIC RANK
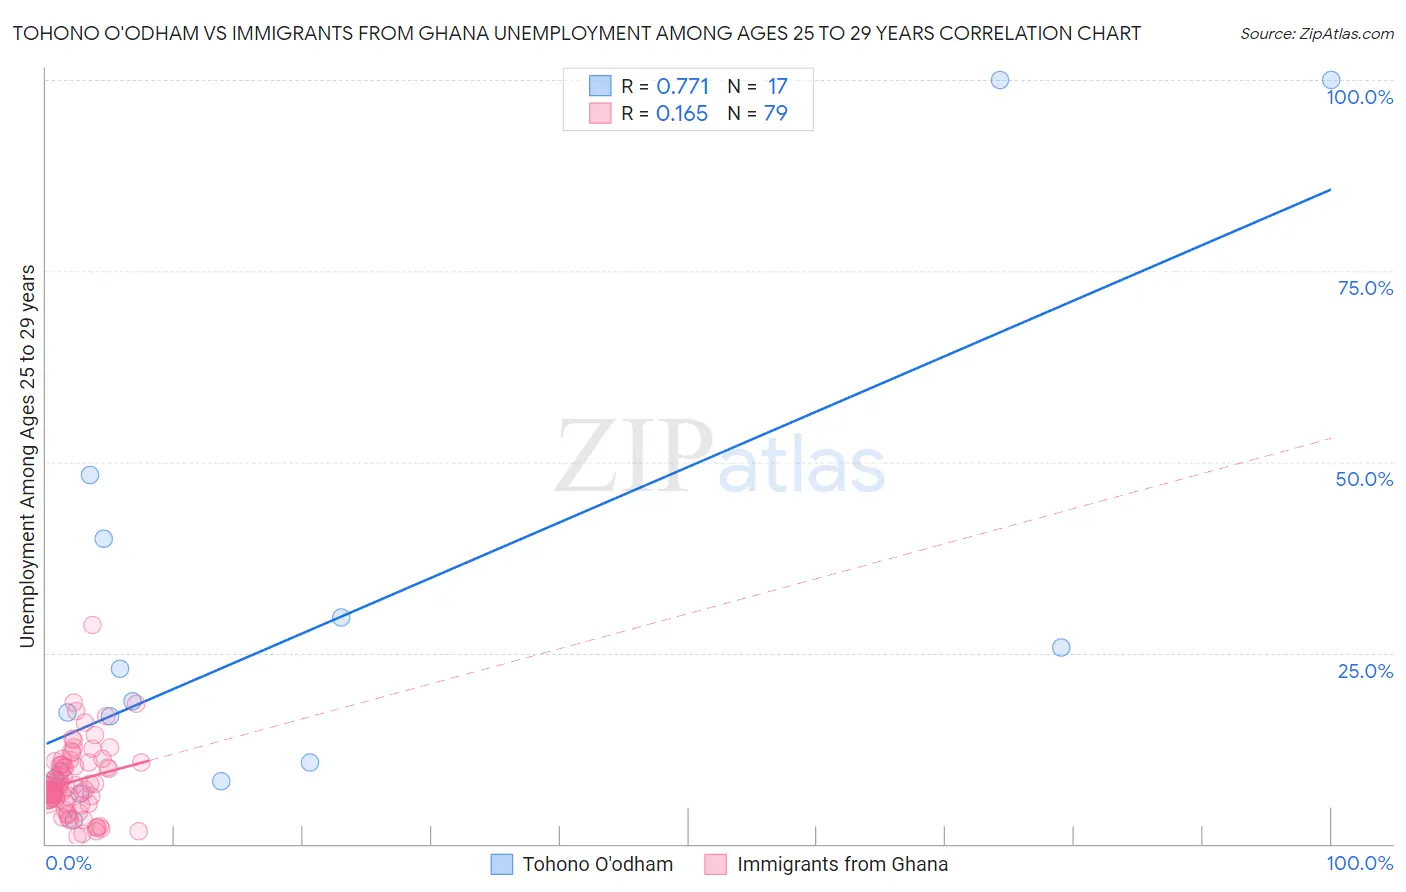
Tohono O'odham vs Immigrants from Ghana Unemployment Among Ages 25 to 29 years Correlation Chart
The statistical analysis conducted on geographies consisting of 58,234,403 people shows a strong positive correlation between the proportion of Tohono O'odham and unemployment rate among population between the ages 25 and 29 in the United States with a correlation coefficient (R) of 0.771 and weighted average of 12.1%. Similarly, the statistical analysis conducted on geographies consisting of 195,845,619 people shows a poor positive correlation between the proportion of Immigrants from Ghana and unemployment rate among population between the ages 25 and 29 in the United States with a correlation coefficient (R) of 0.165 and weighted average of 7.5%, a difference of 61.3%.
Unemployment Among Ages 25 to 29 years Correlation Summary
| Measurement | Tohono O'odham | Immigrants from Ghana |
| Minimum | 3.0% | 0.96% |
| Maximum | 100.0% | 28.7% |
| Range | 97.0% | 27.7% |
| Mean | 27.8% | 8.2% |
| Median | 17.1% | 7.3% |
| Interquartile 25% (IQ1) | 8.3% | 5.8% |
| Interquartile 75% (IQ3) | 34.9% | 10.6% |
| Interquartile Range (IQR) | 26.5% | 4.7% |
| Standard Deviation (Sample) | 29.8% | 4.7% |
| Standard Deviation (Population) | 28.9% | 4.6% |
Similar Demographics by Unemployment Among Ages 25 to 29 years
Demographics Similar to Tohono O'odham by Unemployment Among Ages 25 to 29 years
In terms of unemployment among ages 25 to 29 years, the demographic groups most similar to Tohono O'odham are Navajo (12.2%, a difference of 0.80%), Cheyenne (11.8%, a difference of 2.1%), Pima (11.8%, a difference of 2.5%), Sioux (11.7%, a difference of 3.5%), and Menominee (11.3%, a difference of 7.1%).
| Demographics | Rating | Rank | Unemployment Among Ages 25 to 29 years |
| Alaskan Athabascans | 0.0 /100 | #333 | Tragic 10.8% |
| Yuman | 0.0 /100 | #334 | Tragic 11.0% |
| Puerto Ricans | 0.0 /100 | #335 | Tragic 11.1% |
| Lumbee | 0.0 /100 | #336 | Tragic 11.2% |
| Menominee | 0.0 /100 | #337 | Tragic 11.3% |
| Sioux | 0.0 /100 | #338 | Tragic 11.7% |
| Pima | 0.0 /100 | #339 | Tragic 11.8% |
| Cheyenne | 0.0 /100 | #340 | Tragic 11.8% |
| Tohono O'odham | 0.0 /100 | #341 | Tragic 12.1% |
| Navajo | 0.0 /100 | #342 | Tragic 12.2% |
| Inupiat | 0.0 /100 | #343 | Tragic 13.4% |
| Hopi | 0.0 /100 | #344 | Tragic 13.5% |
| Arapaho | 0.0 /100 | #345 | Tragic 15.4% |
| Crow | 0.0 /100 | #346 | Tragic 15.4% |
| Yup'ik | 0.0 /100 | #347 | Tragic 17.9% |
Demographics Similar to Immigrants from Ghana by Unemployment Among Ages 25 to 29 years
In terms of unemployment among ages 25 to 29 years, the demographic groups most similar to Immigrants from Ghana are Immigrants from Central America (7.5%, a difference of 0.080%), Immigrants from Nigeria (7.5%, a difference of 0.29%), Immigrants from Bahamas (7.5%, a difference of 0.32%), French American Indian (7.5%, a difference of 0.34%), and Choctaw (7.5%, a difference of 0.37%).
| Demographics | Rating | Rank | Unemployment Among Ages 25 to 29 years |
| Immigrants | Ecuador | 0.1 /100 | #268 | Tragic 7.4% |
| Immigrants | Latin America | 0.1 /100 | #269 | Tragic 7.4% |
| Bahamians | 0.0 /100 | #270 | Tragic 7.5% |
| Choctaw | 0.0 /100 | #271 | Tragic 7.5% |
| Immigrants | Bahamas | 0.0 /100 | #272 | Tragic 7.5% |
| Immigrants | Nigeria | 0.0 /100 | #273 | Tragic 7.5% |
| Immigrants | Central America | 0.0 /100 | #274 | Tragic 7.5% |
| Immigrants | Ghana | 0.0 /100 | #275 | Tragic 7.5% |
| French American Indians | 0.0 /100 | #276 | Tragic 7.5% |
| Iroquois | 0.0 /100 | #277 | Tragic 7.5% |
| Mexicans | 0.0 /100 | #278 | Tragic 7.5% |
| Nepalese | 0.0 /100 | #279 | Tragic 7.5% |
| Immigrants | Caribbean | 0.0 /100 | #280 | Tragic 7.5% |
| Immigrants | Bangladesh | 0.0 /100 | #281 | Tragic 7.5% |
| Immigrants | Senegal | 0.0 /100 | #282 | Tragic 7.6% |