Tohono O'odham vs Immigrants from Ghana Unemployment Among Women with Children Under 18 years
COMPARE
Tohono O'odham
Immigrants from Ghana
Unemployment Among Women with Children Under 18 years
Unemployment Among Women with Children Under 18 years Comparison
Tohono O'odham
Immigrants from Ghana
8.9%
UNEMPLOYMENT AMONG WOMEN WITH CHILDREN UNDER 18 YEARS
0.0/ 100
METRIC RATING
341st/ 347
METRIC RANK
6.2%
UNEMPLOYMENT AMONG WOMEN WITH CHILDREN UNDER 18 YEARS
0.0/ 100
METRIC RATING
276th/ 347
METRIC RANK
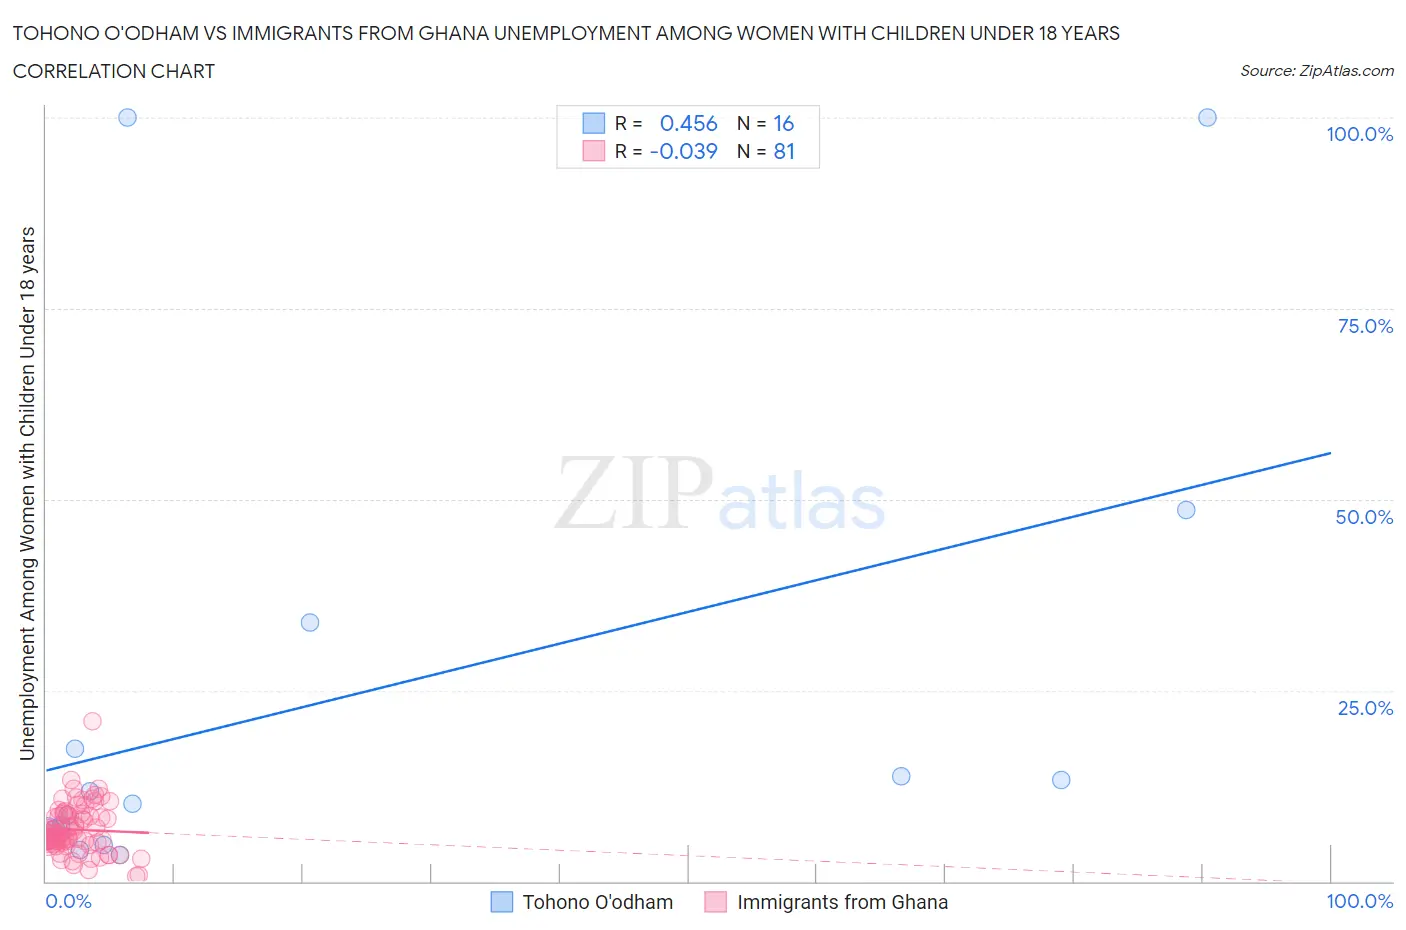
Tohono O'odham vs Immigrants from Ghana Unemployment Among Women with Children Under 18 years Correlation Chart
The statistical analysis conducted on geographies consisting of 58,389,482 people shows a moderate positive correlation between the proportion of Tohono O'odham and unemployment rate among women with children under the age of 18 in the United States with a correlation coefficient (R) of 0.456 and weighted average of 8.9%. Similarly, the statistical analysis conducted on geographies consisting of 196,845,817 people shows no correlation between the proportion of Immigrants from Ghana and unemployment rate among women with children under the age of 18 in the United States with a correlation coefficient (R) of -0.039 and weighted average of 6.2%, a difference of 42.2%.
Unemployment Among Women with Children Under 18 years Correlation Summary
| Measurement | Tohono O'odham | Immigrants from Ghana |
| Minimum | 3.4% | 0.70% |
| Maximum | 100.0% | 21.0% |
| Range | 96.6% | 20.3% |
| Mean | 24.4% | 6.8% |
| Median | 10.9% | 5.8% |
| Interquartile 25% (IQ1) | 6.5% | 5.2% |
| Interquartile 75% (IQ3) | 25.6% | 8.6% |
| Interquartile Range (IQR) | 19.1% | 3.4% |
| Standard Deviation (Sample) | 31.8% | 3.2% |
| Standard Deviation (Population) | 30.8% | 3.2% |
Similar Demographics by Unemployment Among Women with Children Under 18 years
Demographics Similar to Tohono O'odham by Unemployment Among Women with Children Under 18 years
In terms of unemployment among women with children under 18 years, the demographic groups most similar to Tohono O'odham are Puerto Rican (9.0%, a difference of 1.7%), Arapaho (9.2%, a difference of 3.8%), Crow (8.2%, a difference of 7.5%), Navajo (8.2%, a difference of 7.7%), and Inupiat (9.6%, a difference of 8.1%).
| Demographics | Rating | Rank | Unemployment Among Women with Children Under 18 years |
| Immigrants | Dominican Republic | 0.0 /100 | #333 | Tragic 7.5% |
| Cheyenne | 0.0 /100 | #334 | Tragic 7.8% |
| Apache | 0.0 /100 | #335 | Tragic 7.9% |
| Sioux | 0.0 /100 | #336 | Tragic 7.9% |
| Yakama | 0.0 /100 | #337 | Tragic 8.1% |
| Immigrants | Yemen | 0.0 /100 | #338 | Tragic 8.2% |
| Navajo | 0.0 /100 | #339 | Tragic 8.2% |
| Crow | 0.0 /100 | #340 | Tragic 8.2% |
| Tohono O'odham | 0.0 /100 | #341 | Tragic 8.9% |
| Puerto Ricans | 0.0 /100 | #342 | Tragic 9.0% |
| Arapaho | 0.0 /100 | #343 | Tragic 9.2% |
| Inupiat | 0.0 /100 | #344 | Tragic 9.6% |
| Yuman | 0.0 /100 | #345 | Tragic 9.8% |
| Yup'ik | 0.0 /100 | #346 | Tragic 11.0% |
| Pima | 0.0 /100 | #347 | Tragic 11.7% |
Demographics Similar to Immigrants from Ghana by Unemployment Among Women with Children Under 18 years
In terms of unemployment among women with children under 18 years, the demographic groups most similar to Immigrants from Ghana are Mexican American Indian (6.2%, a difference of 0.010%), Immigrants from Barbados (6.2%, a difference of 0.030%), Dutch West Indian (6.2%, a difference of 0.11%), Senegalese (6.2%, a difference of 0.28%), and Immigrants from Western Africa (6.2%, a difference of 0.30%).
| Demographics | Rating | Rank | Unemployment Among Women with Children Under 18 years |
| Cajuns | 0.1 /100 | #269 | Tragic 6.2% |
| Ghanaians | 0.1 /100 | #270 | Tragic 6.2% |
| Central Americans | 0.0 /100 | #271 | Tragic 6.2% |
| Salvadorans | 0.0 /100 | #272 | Tragic 6.2% |
| Immigrants | Western Africa | 0.0 /100 | #273 | Tragic 6.2% |
| Senegalese | 0.0 /100 | #274 | Tragic 6.2% |
| Dutch West Indians | 0.0 /100 | #275 | Tragic 6.2% |
| Immigrants | Ghana | 0.0 /100 | #276 | Tragic 6.2% |
| Mexican American Indians | 0.0 /100 | #277 | Tragic 6.2% |
| Immigrants | Barbados | 0.0 /100 | #278 | Tragic 6.2% |
| Immigrants | Portugal | 0.0 /100 | #279 | Tragic 6.3% |
| Guatemalans | 0.0 /100 | #280 | Tragic 6.3% |
| Immigrants | El Salvador | 0.0 /100 | #281 | Tragic 6.3% |
| Immigrants | St. Vincent and the Grenadines | 0.0 /100 | #282 | Tragic 6.3% |
| West Indians | 0.0 /100 | #283 | Tragic 6.3% |