Tohono O'odham vs Peruvian Unemployment Among Ages 25 to 29 years
COMPARE
Tohono O'odham
Peruvian
Unemployment Among Ages 25 to 29 years
Unemployment Among Ages 25 to 29 years Comparison
Tohono O'odham
Peruvians
12.1%
UNEMPLOYMENT AMONG AGES 25 TO 29 YEARS
0.0/ 100
METRIC RATING
341st/ 347
METRIC RANK
6.6%
UNEMPLOYMENT AMONG AGES 25 TO 29 YEARS
68.1/ 100
METRIC RATING
148th/ 347
METRIC RANK
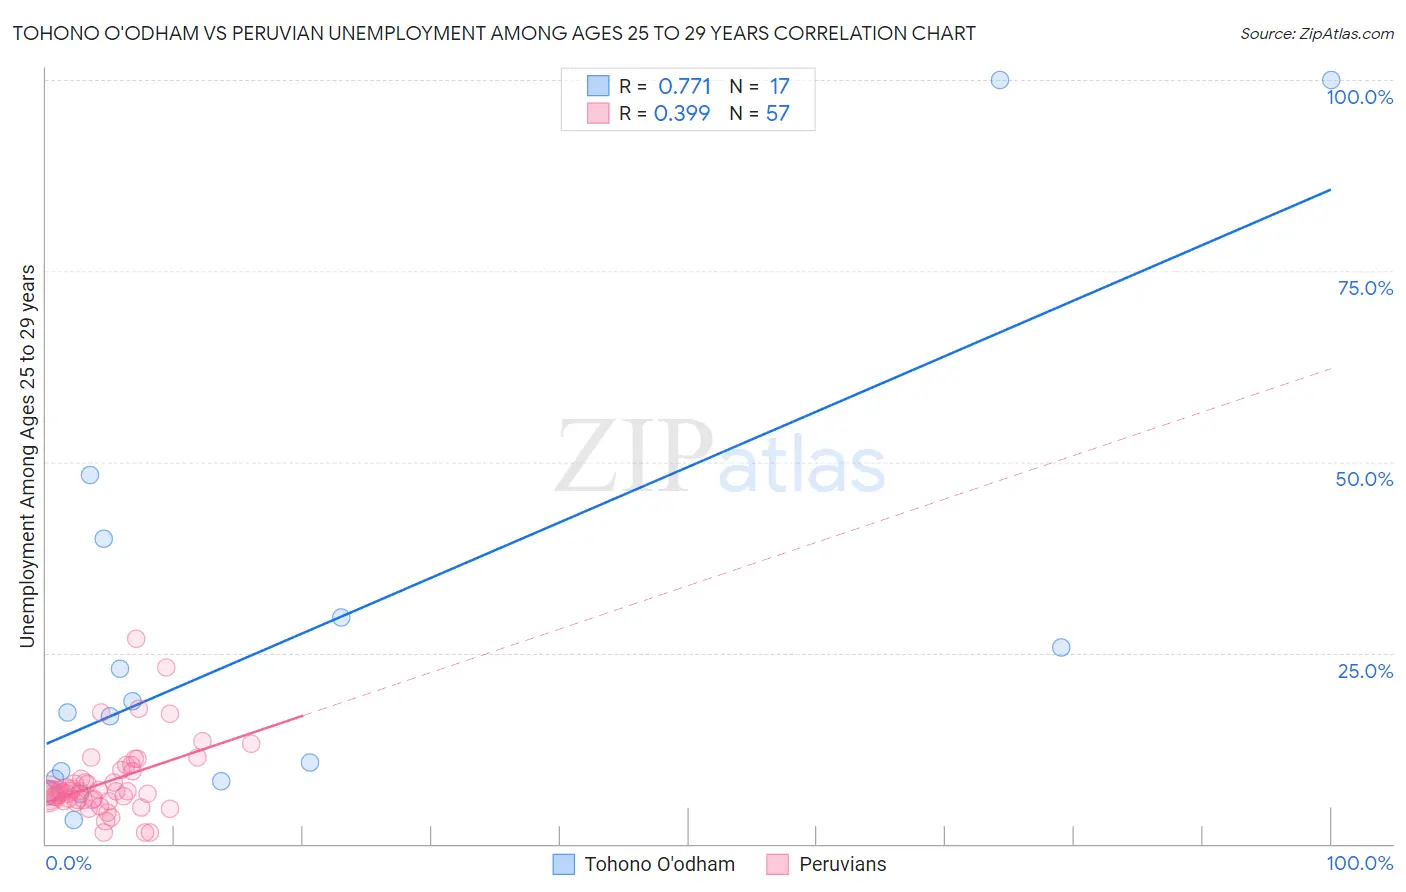
Tohono O'odham vs Peruvian Unemployment Among Ages 25 to 29 years Correlation Chart
The statistical analysis conducted on geographies consisting of 58,234,403 people shows a strong positive correlation between the proportion of Tohono O'odham and unemployment rate among population between the ages 25 and 29 in the United States with a correlation coefficient (R) of 0.771 and weighted average of 12.1%. Similarly, the statistical analysis conducted on geographies consisting of 349,637,012 people shows a mild positive correlation between the proportion of Peruvians and unemployment rate among population between the ages 25 and 29 in the United States with a correlation coefficient (R) of 0.399 and weighted average of 6.6%, a difference of 83.8%.
Unemployment Among Ages 25 to 29 years Correlation Summary
| Measurement | Tohono O'odham | Peruvian |
| Minimum | 3.0% | 1.4% |
| Maximum | 100.0% | 26.8% |
| Range | 97.0% | 25.4% |
| Mean | 27.8% | 8.1% |
| Median | 17.1% | 6.8% |
| Interquartile 25% (IQ1) | 8.3% | 5.7% |
| Interquartile 75% (IQ3) | 34.9% | 9.5% |
| Interquartile Range (IQR) | 26.5% | 3.9% |
| Standard Deviation (Sample) | 29.8% | 4.7% |
| Standard Deviation (Population) | 28.9% | 4.7% |
Similar Demographics by Unemployment Among Ages 25 to 29 years
Demographics Similar to Tohono O'odham by Unemployment Among Ages 25 to 29 years
In terms of unemployment among ages 25 to 29 years, the demographic groups most similar to Tohono O'odham are Navajo (12.2%, a difference of 0.80%), Cheyenne (11.8%, a difference of 2.1%), Pima (11.8%, a difference of 2.5%), Sioux (11.7%, a difference of 3.5%), and Menominee (11.3%, a difference of 7.1%).
| Demographics | Rating | Rank | Unemployment Among Ages 25 to 29 years |
| Alaskan Athabascans | 0.0 /100 | #333 | Tragic 10.8% |
| Yuman | 0.0 /100 | #334 | Tragic 11.0% |
| Puerto Ricans | 0.0 /100 | #335 | Tragic 11.1% |
| Lumbee | 0.0 /100 | #336 | Tragic 11.2% |
| Menominee | 0.0 /100 | #337 | Tragic 11.3% |
| Sioux | 0.0 /100 | #338 | Tragic 11.7% |
| Pima | 0.0 /100 | #339 | Tragic 11.8% |
| Cheyenne | 0.0 /100 | #340 | Tragic 11.8% |
| Tohono O'odham | 0.0 /100 | #341 | Tragic 12.1% |
| Navajo | 0.0 /100 | #342 | Tragic 12.2% |
| Inupiat | 0.0 /100 | #343 | Tragic 13.4% |
| Hopi | 0.0 /100 | #344 | Tragic 13.5% |
| Arapaho | 0.0 /100 | #345 | Tragic 15.4% |
| Crow | 0.0 /100 | #346 | Tragic 15.4% |
| Yup'ik | 0.0 /100 | #347 | Tragic 17.9% |
Demographics Similar to Peruvians by Unemployment Among Ages 25 to 29 years
In terms of unemployment among ages 25 to 29 years, the demographic groups most similar to Peruvians are Immigrants from Thailand (6.6%, a difference of 0.020%), Malaysian (6.6%, a difference of 0.070%), Finnish (6.6%, a difference of 0.080%), Romanian (6.6%, a difference of 0.10%), and Nicaraguan (6.6%, a difference of 0.15%).
| Demographics | Rating | Rank | Unemployment Among Ages 25 to 29 years |
| Maltese | 72.9 /100 | #141 | Good 6.5% |
| Slavs | 72.5 /100 | #142 | Good 6.5% |
| Lithuanians | 72.2 /100 | #143 | Good 6.5% |
| Immigrants | Micronesia | 71.5 /100 | #144 | Good 6.6% |
| Nicaraguans | 70.2 /100 | #145 | Good 6.6% |
| Romanians | 69.5 /100 | #146 | Good 6.6% |
| Immigrants | Thailand | 68.4 /100 | #147 | Good 6.6% |
| Peruvians | 68.1 /100 | #148 | Good 6.6% |
| Malaysians | 67.1 /100 | #149 | Good 6.6% |
| Finns | 66.9 /100 | #150 | Good 6.6% |
| Ukrainians | 65.5 /100 | #151 | Good 6.6% |
| Samoans | 64.6 /100 | #152 | Good 6.6% |
| Immigrants | Italy | 64.4 /100 | #153 | Good 6.6% |
| Colombians | 64.0 /100 | #154 | Good 6.6% |
| Immigrants | Latvia | 63.9 /100 | #155 | Good 6.6% |