Cheyenne vs Russian Unemployment Among Ages 60 to 64 years
COMPARE
Cheyenne
Russian
Unemployment Among Ages 60 to 64 years
Unemployment Among Ages 60 to 64 years Comparison
Cheyenne
Russians
5.6%
UNEMPLOYMENT AMONG AGES 60 TO 64 YEARS
0.0/ 100
METRIC RATING
316th/ 347
METRIC RANK
4.9%
UNEMPLOYMENT AMONG AGES 60 TO 64 YEARS
18.9/ 100
METRIC RATING
204th/ 347
METRIC RANK
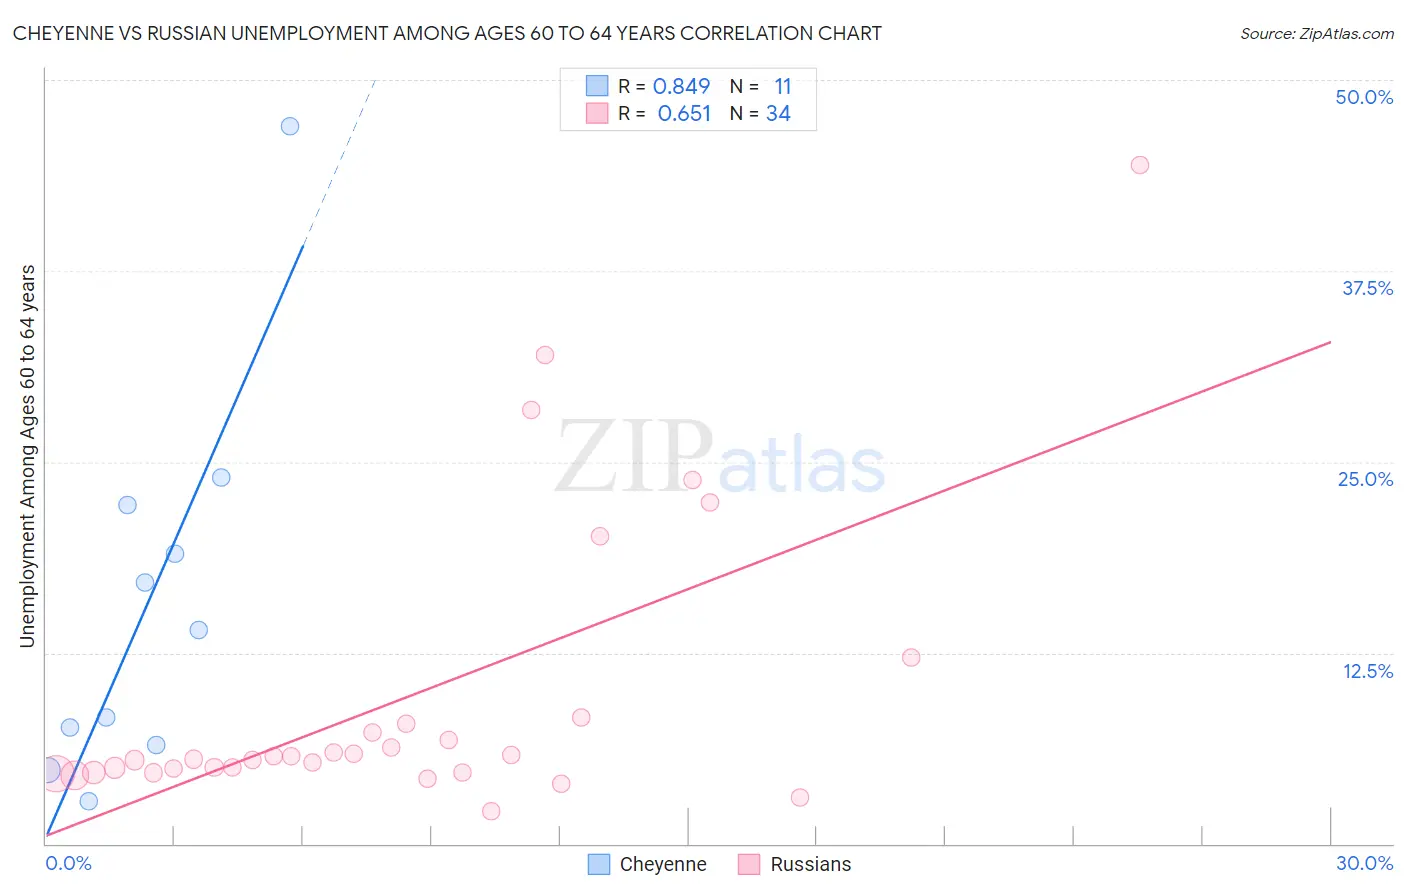
Cheyenne vs Russian Unemployment Among Ages 60 to 64 years Correlation Chart
The statistical analysis conducted on geographies consisting of 77,275,074 people shows a very strong positive correlation between the proportion of Cheyenne and unemployment rate among population between the ages 60 and 64 in the United States with a correlation coefficient (R) of 0.849 and weighted average of 5.6%. Similarly, the statistical analysis conducted on geographies consisting of 438,522,648 people shows a significant positive correlation between the proportion of Russians and unemployment rate among population between the ages 60 and 64 in the United States with a correlation coefficient (R) of 0.651 and weighted average of 4.9%, a difference of 14.0%.
Unemployment Among Ages 60 to 64 years Correlation Summary
| Measurement | Cheyenne | Russian |
| Minimum | 2.8% | 2.1% |
| Maximum | 47.0% | 44.4% |
| Range | 44.2% | 42.3% |
| Mean | 15.7% | 9.6% |
| Median | 14.0% | 5.6% |
| Interquartile 25% (IQ1) | 6.5% | 4.7% |
| Interquartile 75% (IQ3) | 22.2% | 7.8% |
| Interquartile Range (IQR) | 15.7% | 3.2% |
| Standard Deviation (Sample) | 12.6% | 9.7% |
| Standard Deviation (Population) | 12.1% | 9.5% |
Similar Demographics by Unemployment Among Ages 60 to 64 years
Demographics Similar to Cheyenne by Unemployment Among Ages 60 to 64 years
In terms of unemployment among ages 60 to 64 years, the demographic groups most similar to Cheyenne are Cree (5.6%, a difference of 0.36%), Shoshone (5.7%, a difference of 0.87%), Native/Alaskan (5.7%, a difference of 0.91%), Immigrants from Belize (5.7%, a difference of 1.4%), and Guyanese (5.5%, a difference of 1.7%).
| Demographics | Rating | Rank | Unemployment Among Ages 60 to 64 years |
| Soviet Union | 0.0 /100 | #309 | Tragic 5.4% |
| British West Indians | 0.0 /100 | #310 | Tragic 5.5% |
| U.S. Virgin Islanders | 0.0 /100 | #311 | Tragic 5.5% |
| Immigrants | West Indies | 0.0 /100 | #312 | Tragic 5.5% |
| Belizeans | 0.0 /100 | #313 | Tragic 5.5% |
| Guyanese | 0.0 /100 | #314 | Tragic 5.5% |
| Cree | 0.0 /100 | #315 | Tragic 5.6% |
| Cheyenne | 0.0 /100 | #316 | Tragic 5.6% |
| Shoshone | 0.0 /100 | #317 | Tragic 5.7% |
| Natives/Alaskans | 0.0 /100 | #318 | Tragic 5.7% |
| Immigrants | Belize | 0.0 /100 | #319 | Tragic 5.7% |
| Colville | 0.0 /100 | #320 | Tragic 5.7% |
| Dutch West Indians | 0.0 /100 | #321 | Tragic 5.7% |
| Ecuadorians | 0.0 /100 | #322 | Tragic 5.8% |
| Alsatians | 0.0 /100 | #323 | Tragic 5.8% |
Demographics Similar to Russians by Unemployment Among Ages 60 to 64 years
In terms of unemployment among ages 60 to 64 years, the demographic groups most similar to Russians are Uruguayan (4.9%, a difference of 0.060%), Immigrants from Indonesia (4.9%, a difference of 0.080%), New Zealander (4.9%, a difference of 0.080%), Chippewa (4.9%, a difference of 0.090%), and Immigrants from Western Africa (4.9%, a difference of 0.10%).
| Demographics | Rating | Rank | Unemployment Among Ages 60 to 64 years |
| Immigrants | Eastern Europe | 25.2 /100 | #197 | Fair 4.9% |
| Guamanians/Chamorros | 23.7 /100 | #198 | Fair 4.9% |
| Immigrants | Vietnam | 23.7 /100 | #199 | Fair 4.9% |
| Immigrants | Czechoslovakia | 23.5 /100 | #200 | Fair 4.9% |
| Colombians | 22.7 /100 | #201 | Fair 4.9% |
| Immigrants | Western Africa | 20.6 /100 | #202 | Fair 4.9% |
| Uruguayans | 19.9 /100 | #203 | Poor 4.9% |
| Russians | 18.9 /100 | #204 | Poor 4.9% |
| Immigrants | Indonesia | 17.4 /100 | #205 | Poor 4.9% |
| New Zealanders | 17.4 /100 | #206 | Poor 4.9% |
| Chippewa | 17.3 /100 | #207 | Poor 4.9% |
| German Russians | 16.8 /100 | #208 | Poor 4.9% |
| Sierra Leoneans | 16.5 /100 | #209 | Poor 4.9% |
| Cherokee | 16.1 /100 | #210 | Poor 4.9% |
| Blackfeet | 15.7 /100 | #211 | Poor 4.9% |