Macedonian vs Native Hawaiian Unemployment Among Ages 55 to 59 years
COMPARE
Macedonian
Native Hawaiian
Unemployment Among Ages 55 to 59 years
Unemployment Among Ages 55 to 59 years Comparison
Macedonians
Native Hawaiians
4.9%
UNEMPLOYMENT AMONG AGES 55 TO 59 YEARS
26.4/ 100
METRIC RATING
197th/ 347
METRIC RANK
5.1%
UNEMPLOYMENT AMONG AGES 55 TO 59 YEARS
0.5/ 100
METRIC RATING
248th/ 347
METRIC RANK
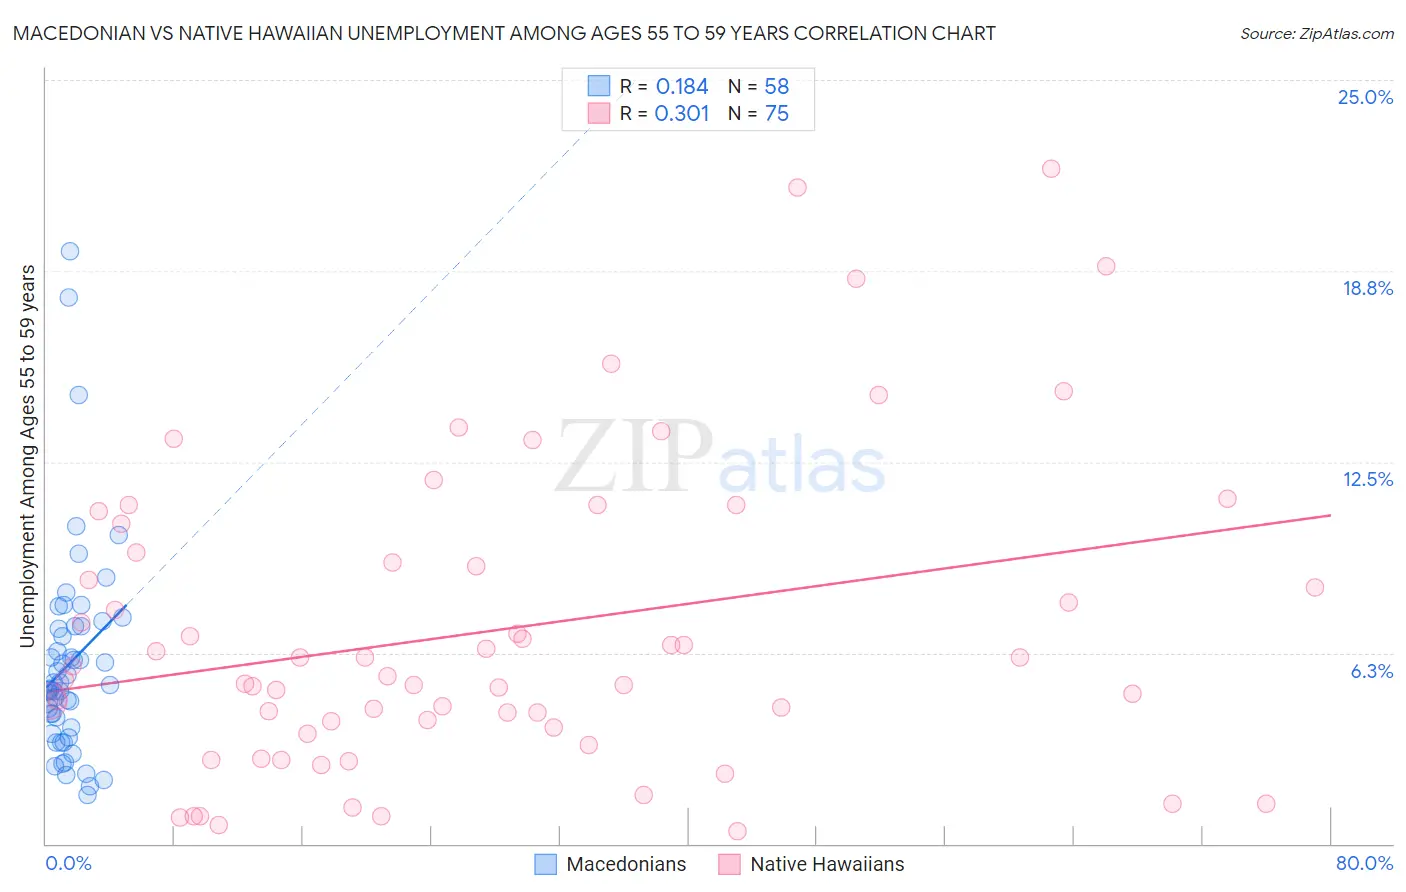
Macedonian vs Native Hawaiian Unemployment Among Ages 55 to 59 years Correlation Chart
The statistical analysis conducted on geographies consisting of 128,838,233 people shows a poor positive correlation between the proportion of Macedonians and unemployment rate among population between the ages 55 and 59 in the United States with a correlation coefficient (R) of 0.184 and weighted average of 4.9%. Similarly, the statistical analysis conducted on geographies consisting of 311,037,033 people shows a mild positive correlation between the proportion of Native Hawaiians and unemployment rate among population between the ages 55 and 59 in the United States with a correlation coefficient (R) of 0.301 and weighted average of 5.1%, a difference of 4.4%.
Unemployment Among Ages 55 to 59 years Correlation Summary
| Measurement | Macedonian | Native Hawaiian |
| Minimum | 1.6% | 0.40% |
| Maximum | 19.4% | 22.1% |
| Range | 17.8% | 21.7% |
| Mean | 5.9% | 7.0% |
| Median | 5.1% | 5.5% |
| Interquartile 25% (IQ1) | 3.8% | 3.8% |
| Interquartile 75% (IQ3) | 7.1% | 9.5% |
| Interquartile Range (IQR) | 3.3% | 5.7% |
| Standard Deviation (Sample) | 3.4% | 5.0% |
| Standard Deviation (Population) | 3.4% | 4.9% |
Similar Demographics by Unemployment Among Ages 55 to 59 years
Demographics Similar to Macedonians by Unemployment Among Ages 55 to 59 years
In terms of unemployment among ages 55 to 59 years, the demographic groups most similar to Macedonians are Eastern European (4.9%, a difference of 0.010%), Immigrants from Philippines (4.9%, a difference of 0.010%), Spaniard (4.9%, a difference of 0.040%), Estonian (4.9%, a difference of 0.040%), and Immigrants from Russia (4.9%, a difference of 0.15%).
| Demographics | Rating | Rank | Unemployment Among Ages 55 to 59 years |
| Russians | 33.9 /100 | #190 | Fair 4.9% |
| Iranians | 32.4 /100 | #191 | Fair 4.9% |
| Immigrants | Ukraine | 31.7 /100 | #192 | Fair 4.9% |
| Immigrants | Italy | 30.1 /100 | #193 | Fair 4.9% |
| Spaniards | 27.2 /100 | #194 | Fair 4.9% |
| Estonians | 27.2 /100 | #195 | Fair 4.9% |
| Eastern Europeans | 26.7 /100 | #196 | Fair 4.9% |
| Macedonians | 26.4 /100 | #197 | Fair 4.9% |
| Immigrants | Philippines | 26.1 /100 | #198 | Fair 4.9% |
| Immigrants | Russia | 23.7 /100 | #199 | Fair 4.9% |
| Basques | 23.3 /100 | #200 | Fair 4.9% |
| Immigrants | South America | 23.1 /100 | #201 | Fair 4.9% |
| Lumbee | 22.5 /100 | #202 | Fair 4.9% |
| Guamanians/Chamorros | 20.8 /100 | #203 | Fair 4.9% |
| Immigrants | Latvia | 18.5 /100 | #204 | Poor 4.9% |
Demographics Similar to Native Hawaiians by Unemployment Among Ages 55 to 59 years
In terms of unemployment among ages 55 to 59 years, the demographic groups most similar to Native Hawaiians are Comanche (5.1%, a difference of 0.030%), Immigrants from Honduras (5.1%, a difference of 0.17%), Immigrants from Greece (5.1%, a difference of 0.18%), Soviet Union (5.1%, a difference of 0.20%), and Cheyenne (5.1%, a difference of 0.21%).
| Demographics | Rating | Rank | Unemployment Among Ages 55 to 59 years |
| Brazilians | 1.0 /100 | #241 | Tragic 5.0% |
| Liberians | 0.9 /100 | #242 | Tragic 5.1% |
| Hondurans | 0.7 /100 | #243 | Tragic 5.1% |
| Immigrants | Fiji | 0.7 /100 | #244 | Tragic 5.1% |
| Soviet Union | 0.6 /100 | #245 | Tragic 5.1% |
| Immigrants | Greece | 0.6 /100 | #246 | Tragic 5.1% |
| Immigrants | Honduras | 0.5 /100 | #247 | Tragic 5.1% |
| Native Hawaiians | 0.5 /100 | #248 | Tragic 5.1% |
| Comanche | 0.4 /100 | #249 | Tragic 5.1% |
| Cheyenne | 0.4 /100 | #250 | Tragic 5.1% |
| Portuguese | 0.3 /100 | #251 | Tragic 5.1% |
| U.S. Virgin Islanders | 0.3 /100 | #252 | Tragic 5.1% |
| Paraguayans | 0.3 /100 | #253 | Tragic 5.1% |
| Seminole | 0.3 /100 | #254 | Tragic 5.1% |
| Blackfeet | 0.3 /100 | #255 | Tragic 5.1% |