Immigrants from Liberia vs Native Hawaiian Unemployment Among Ages 55 to 59 years
COMPARE
Immigrants from Liberia
Native Hawaiian
Unemployment Among Ages 55 to 59 years
Unemployment Among Ages 55 to 59 years Comparison
Immigrants from Liberia
Native Hawaiians
5.0%
UNEMPLOYMENT AMONG AGES 55 TO 59 YEARS
3.2/ 100
METRIC RATING
228th/ 347
METRIC RANK
5.1%
UNEMPLOYMENT AMONG AGES 55 TO 59 YEARS
0.5/ 100
METRIC RATING
248th/ 347
METRIC RANK
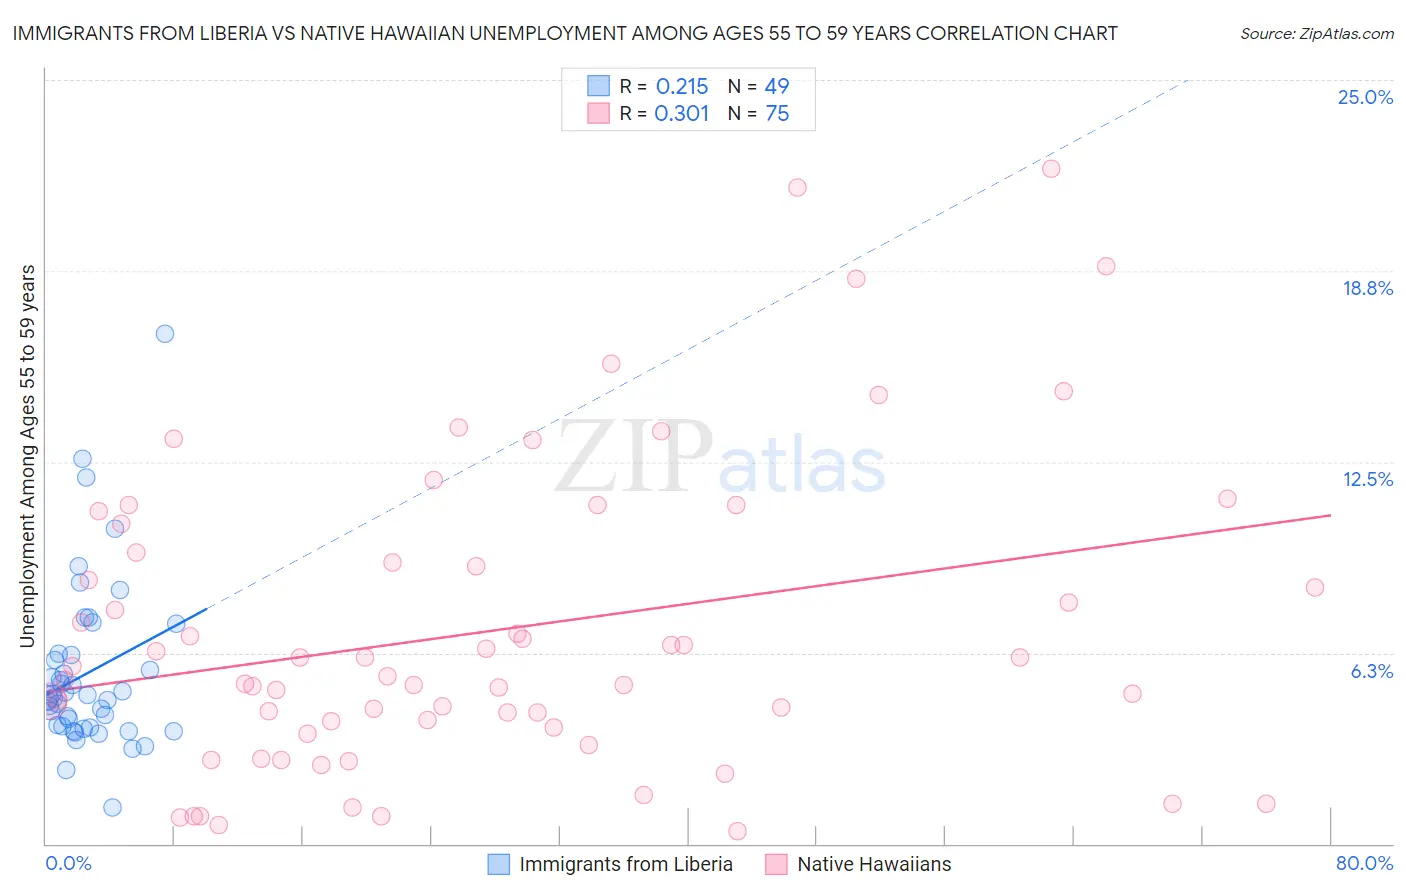
Immigrants from Liberia vs Native Hawaiian Unemployment Among Ages 55 to 59 years Correlation Chart
The statistical analysis conducted on geographies consisting of 131,927,526 people shows a weak positive correlation between the proportion of Immigrants from Liberia and unemployment rate among population between the ages 55 and 59 in the United States with a correlation coefficient (R) of 0.215 and weighted average of 5.0%. Similarly, the statistical analysis conducted on geographies consisting of 311,037,033 people shows a mild positive correlation between the proportion of Native Hawaiians and unemployment rate among population between the ages 55 and 59 in the United States with a correlation coefficient (R) of 0.301 and weighted average of 5.1%, a difference of 2.0%.
Unemployment Among Ages 55 to 59 years Correlation Summary
| Measurement | Immigrants from Liberia | Native Hawaiian |
| Minimum | 1.2% | 0.40% |
| Maximum | 16.7% | 22.1% |
| Range | 15.5% | 21.7% |
| Mean | 5.6% | 7.0% |
| Median | 4.8% | 5.5% |
| Interquartile 25% (IQ1) | 3.8% | 3.8% |
| Interquartile 75% (IQ3) | 6.2% | 9.5% |
| Interquartile Range (IQR) | 2.4% | 5.7% |
| Standard Deviation (Sample) | 2.8% | 5.0% |
| Standard Deviation (Population) | 2.8% | 4.9% |
Demographics Similar to Immigrants from Liberia and Native Hawaiians by Unemployment Among Ages 55 to 59 years
In terms of unemployment among ages 55 to 59 years, the demographic groups most similar to Immigrants from Liberia are Immigrants from Western Asia (5.0%, a difference of 0.080%), Immigrants from Syria (5.0%, a difference of 0.18%), Cherokee (5.0%, a difference of 0.21%), Albanian (5.0%, a difference of 0.26%), and Immigrants (5.0%, a difference of 0.34%). Similarly, the demographic groups most similar to Native Hawaiians are Immigrants from Honduras (5.1%, a difference of 0.17%), Immigrants from Greece (5.1%, a difference of 0.18%), Soviet Union (5.1%, a difference of 0.20%), Immigrants from Fiji (5.1%, a difference of 0.41%), and Honduran (5.1%, a difference of 0.42%).
| Demographics | Rating | Rank | Unemployment Among Ages 55 to 59 years |
| Immigrants | Liberia | 3.2 /100 | #228 | Tragic 5.0% |
| Immigrants | Western Asia | 3.0 /100 | #229 | Tragic 5.0% |
| Immigrants | Syria | 2.7 /100 | #230 | Tragic 5.0% |
| Cherokee | 2.6 /100 | #231 | Tragic 5.0% |
| Albanians | 2.5 /100 | #232 | Tragic 5.0% |
| Immigrants | Immigrants | 2.3 /100 | #233 | Tragic 5.0% |
| Immigrants | Southern Europe | 1.8 /100 | #234 | Tragic 5.0% |
| Immigrants | Hong Kong | 1.4 /100 | #235 | Tragic 5.0% |
| Immigrants | Albania | 1.3 /100 | #236 | Tragic 5.0% |
| Choctaw | 1.3 /100 | #237 | Tragic 5.0% |
| Moroccans | 1.3 /100 | #238 | Tragic 5.0% |
| French American Indians | 1.2 /100 | #239 | Tragic 5.0% |
| Immigrants | Costa Rica | 1.1 /100 | #240 | Tragic 5.0% |
| Brazilians | 1.0 /100 | #241 | Tragic 5.0% |
| Liberians | 0.9 /100 | #242 | Tragic 5.1% |
| Hondurans | 0.7 /100 | #243 | Tragic 5.1% |
| Immigrants | Fiji | 0.7 /100 | #244 | Tragic 5.1% |
| Soviet Union | 0.6 /100 | #245 | Tragic 5.1% |
| Immigrants | Greece | 0.6 /100 | #246 | Tragic 5.1% |
| Immigrants | Honduras | 0.5 /100 | #247 | Tragic 5.1% |
| Native Hawaiians | 0.5 /100 | #248 | Tragic 5.1% |