Tlingit-Haida vs Native/Alaskan Unemployment Among Ages 35 to 44 years
COMPARE
Tlingit-Haida
Native/Alaskan
Unemployment Among Ages 35 to 44 years
Unemployment Among Ages 35 to 44 years Comparison
Tlingit-Haida
Natives/Alaskans
4.3%
UNEMPLOYMENT AMONG AGES 35 TO 44 YEARS
99.5/ 100
METRIC RATING
24th/ 347
METRIC RANK
7.3%
UNEMPLOYMENT AMONG AGES 35 TO 44 YEARS
0.0/ 100
METRIC RATING
332nd/ 347
METRIC RANK
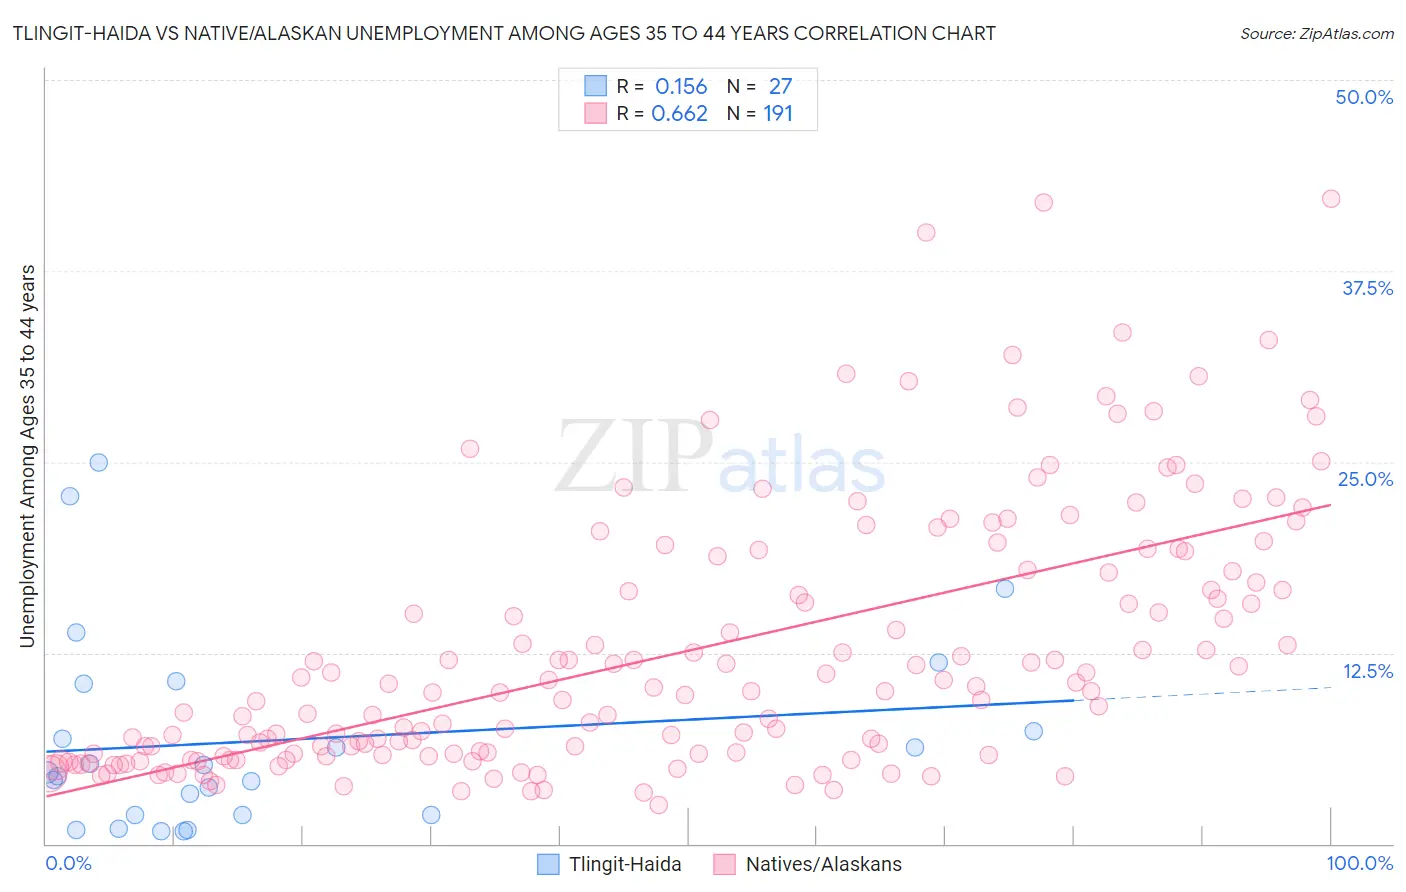
Tlingit-Haida vs Native/Alaskan Unemployment Among Ages 35 to 44 years Correlation Chart
The statistical analysis conducted on geographies consisting of 60,489,726 people shows a poor positive correlation between the proportion of Tlingit-Haida and unemployment rate among population between the ages 35 and 44 in the United States with a correlation coefficient (R) of 0.156 and weighted average of 4.3%. Similarly, the statistical analysis conducted on geographies consisting of 490,779,782 people shows a significant positive correlation between the proportion of Natives/Alaskans and unemployment rate among population between the ages 35 and 44 in the United States with a correlation coefficient (R) of 0.662 and weighted average of 7.3%, a difference of 70.6%.
Unemployment Among Ages 35 to 44 years Correlation Summary
| Measurement | Tlingit-Haida | Native/Alaskan |
| Minimum | 0.80% | 2.5% |
| Maximum | 25.0% | 42.2% |
| Range | 24.2% | 39.7% |
| Mean | 6.8% | 12.6% |
| Median | 4.7% | 10.0% |
| Interquartile 25% (IQ1) | 1.9% | 5.8% |
| Interquartile 75% (IQ3) | 10.5% | 17.9% |
| Interquartile Range (IQR) | 8.6% | 12.0% |
| Standard Deviation (Sample) | 6.5% | 8.5% |
| Standard Deviation (Population) | 6.3% | 8.5% |
Similar Demographics by Unemployment Among Ages 35 to 44 years
Demographics Similar to Tlingit-Haida by Unemployment Among Ages 35 to 44 years
In terms of unemployment among ages 35 to 44 years, the demographic groups most similar to Tlingit-Haida are Immigrants from Kuwait (4.3%, a difference of 0.010%), Scandinavian (4.2%, a difference of 0.16%), Paraguayan (4.2%, a difference of 0.42%), Bulgarian (4.3%, a difference of 0.47%), and Turkish (4.3%, a difference of 0.53%).
| Demographics | Rating | Rank | Unemployment Among Ages 35 to 44 years |
| Swedes | 99.8 /100 | #17 | Exceptional 4.2% |
| Latvians | 99.8 /100 | #18 | Exceptional 4.2% |
| Immigrants | Nepal | 99.7 /100 | #19 | Exceptional 4.2% |
| Immigrants | Bolivia | 99.7 /100 | #20 | Exceptional 4.2% |
| Paraguayans | 99.6 /100 | #21 | Exceptional 4.2% |
| Scandinavians | 99.5 /100 | #22 | Exceptional 4.2% |
| Immigrants | Kuwait | 99.5 /100 | #23 | Exceptional 4.3% |
| Tlingit-Haida | 99.5 /100 | #24 | Exceptional 4.3% |
| Bulgarians | 99.3 /100 | #25 | Exceptional 4.3% |
| Turks | 99.3 /100 | #26 | Exceptional 4.3% |
| Assyrians/Chaldeans/Syriacs | 99.3 /100 | #27 | Exceptional 4.3% |
| Immigrants | Japan | 99.3 /100 | #28 | Exceptional 4.3% |
| Europeans | 99.2 /100 | #29 | Exceptional 4.3% |
| Immigrants | Pakistan | 99.2 /100 | #30 | Exceptional 4.3% |
| Carpatho Rusyns | 99.2 /100 | #31 | Exceptional 4.3% |
Demographics Similar to Natives/Alaskans by Unemployment Among Ages 35 to 44 years
In terms of unemployment among ages 35 to 44 years, the demographic groups most similar to Natives/Alaskans are Pueblo (7.1%, a difference of 2.9%), Puerto Rican (7.6%, a difference of 5.2%), Immigrants from Cabo Verde (6.9%, a difference of 5.5%), Paiute (6.9%, a difference of 5.5%), and Houma (7.8%, a difference of 8.0%).
| Demographics | Rating | Rank | Unemployment Among Ages 35 to 44 years |
| Immigrants | Yemen | 0.0 /100 | #325 | Tragic 6.6% |
| Alaska Natives | 0.0 /100 | #326 | Tragic 6.6% |
| Cape Verdeans | 0.0 /100 | #327 | Tragic 6.6% |
| Shoshone | 0.0 /100 | #328 | Tragic 6.6% |
| Paiute | 0.0 /100 | #329 | Tragic 6.9% |
| Immigrants | Cabo Verde | 0.0 /100 | #330 | Tragic 6.9% |
| Pueblo | 0.0 /100 | #331 | Tragic 7.1% |
| Natives/Alaskans | 0.0 /100 | #332 | Tragic 7.3% |
| Puerto Ricans | 0.0 /100 | #333 | Tragic 7.6% |
| Houma | 0.0 /100 | #334 | Tragic 7.8% |
| Sioux | 0.0 /100 | #335 | Tragic 8.4% |
| Apache | 0.0 /100 | #336 | Tragic 8.4% |
| Tohono O'odham | 0.0 /100 | #337 | Tragic 8.4% |
| Cheyenne | 0.0 /100 | #338 | Tragic 8.5% |
| Inupiat | 0.0 /100 | #339 | Tragic 8.6% |