Cherokee vs Immigrants from South America Unemployment Among Seniors over 75 years
COMPARE
Cherokee
Immigrants from South America
Unemployment Among Seniors over 75 years
Unemployment Among Seniors over 75 years Comparison
Cherokee
Immigrants from South America
9.8%
UNEMPLOYMENT AMONG SENIORS OVER 75 YEARS
0.0/ 100
METRIC RATING
297th/ 347
METRIC RANK
8.6%
UNEMPLOYMENT AMONG SENIORS OVER 75 YEARS
71.3/ 100
METRIC RATING
162nd/ 347
METRIC RANK
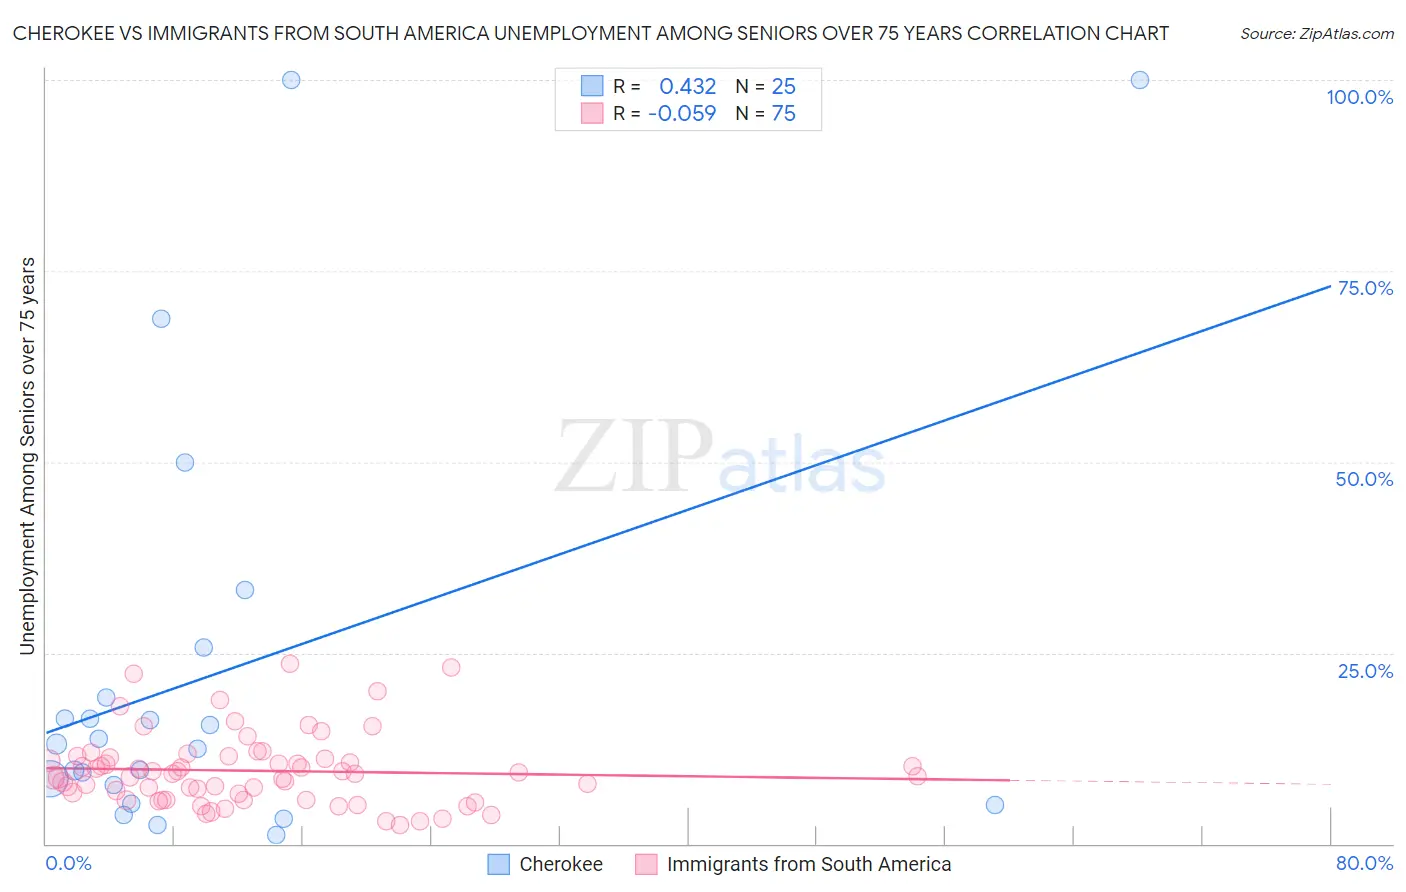
Cherokee vs Immigrants from South America Unemployment Among Seniors over 75 years Correlation Chart
The statistical analysis conducted on geographies consisting of 219,338,381 people shows a moderate positive correlation between the proportion of Cherokee and unemployment rate among seniors over the age of 75 in the United States with a correlation coefficient (R) of 0.432 and weighted average of 9.8%. Similarly, the statistical analysis conducted on geographies consisting of 224,227,019 people shows a slight negative correlation between the proportion of Immigrants from South America and unemployment rate among seniors over the age of 75 in the United States with a correlation coefficient (R) of -0.059 and weighted average of 8.6%, a difference of 14.0%.
Unemployment Among Seniors over 75 years Correlation Summary
| Measurement | Cherokee | Immigrants from South America |
| Minimum | 1.2% | 2.4% |
| Maximum | 100.0% | 23.6% |
| Range | 98.8% | 21.2% |
| Mean | 22.7% | 9.6% |
| Median | 13.1% | 9.2% |
| Interquartile 25% (IQ1) | 6.5% | 5.8% |
| Interquartile 75% (IQ3) | 22.4% | 11.3% |
| Interquartile Range (IQR) | 15.9% | 5.5% |
| Standard Deviation (Sample) | 27.8% | 4.7% |
| Standard Deviation (Population) | 27.3% | 4.6% |
Similar Demographics by Unemployment Among Seniors over 75 years
Demographics Similar to Cherokee by Unemployment Among Seniors over 75 years
In terms of unemployment among seniors over 75 years, the demographic groups most similar to Cherokee are Immigrants from St. Vincent and the Grenadines (9.8%, a difference of 0.080%), Nonimmigrants (9.8%, a difference of 0.13%), Lithuanian (9.9%, a difference of 0.38%), Immigrants from Dominica (9.8%, a difference of 0.50%), and Norwegian (9.8%, a difference of 0.56%).
| Demographics | Rating | Rank | Unemployment Among Seniors over 75 years |
| Sioux | 0.0 /100 | #290 | Tragic 9.7% |
| Scandinavians | 0.0 /100 | #291 | Tragic 9.7% |
| Immigrants | Western Africa | 0.0 /100 | #292 | Tragic 9.8% |
| Norwegians | 0.0 /100 | #293 | Tragic 9.8% |
| Immigrants | Dominica | 0.0 /100 | #294 | Tragic 9.8% |
| Immigrants | Nonimmigrants | 0.0 /100 | #295 | Tragic 9.8% |
| Immigrants | St. Vincent and the Grenadines | 0.0 /100 | #296 | Tragic 9.8% |
| Cherokee | 0.0 /100 | #297 | Tragic 9.8% |
| Lithuanians | 0.0 /100 | #298 | Tragic 9.9% |
| Belgians | 0.0 /100 | #299 | Tragic 9.9% |
| Iraqis | 0.0 /100 | #300 | Tragic 9.9% |
| Welsh | 0.0 /100 | #301 | Tragic 10.0% |
| Finns | 0.0 /100 | #302 | Tragic 10.0% |
| Puget Sound Salish | 0.0 /100 | #303 | Tragic 10.0% |
| Scotch-Irish | 0.0 /100 | #304 | Tragic 10.0% |
Demographics Similar to Immigrants from South America by Unemployment Among Seniors over 75 years
In terms of unemployment among seniors over 75 years, the demographic groups most similar to Immigrants from South America are Cree (8.6%, a difference of 0.10%), Albanian (8.6%, a difference of 0.10%), Immigrants from Guatemala (8.7%, a difference of 0.19%), Shoshone (8.6%, a difference of 0.23%), and Ethiopian (8.6%, a difference of 0.28%).
| Demographics | Rating | Rank | Unemployment Among Seniors over 75 years |
| Ecuadorians | 78.5 /100 | #155 | Good 8.6% |
| Immigrants | Bahamas | 76.5 /100 | #156 | Good 8.6% |
| Turks | 76.4 /100 | #157 | Good 8.6% |
| Ethiopians | 75.3 /100 | #158 | Good 8.6% |
| Shoshone | 74.6 /100 | #159 | Good 8.6% |
| Cree | 72.8 /100 | #160 | Good 8.6% |
| Albanians | 72.8 /100 | #161 | Good 8.6% |
| Immigrants | South America | 71.3 /100 | #162 | Good 8.6% |
| Immigrants | Guatemala | 68.4 /100 | #163 | Good 8.7% |
| Paraguayans | 62.2 /100 | #164 | Good 8.7% |
| Immigrants | Dominican Republic | 61.4 /100 | #165 | Good 8.7% |
| Immigrants | Belize | 57.6 /100 | #166 | Average 8.7% |
| Immigrants | Eastern Africa | 57.6 /100 | #167 | Average 8.7% |
| Immigrants | Lithuania | 57.2 /100 | #168 | Average 8.7% |
| Fijians | 56.4 /100 | #169 | Average 8.7% |