Somali vs English Unemployment Among Seniors over 65 years
COMPARE
Somali
English
Unemployment Among Seniors over 65 years
Unemployment Among Seniors over 65 years Comparison
Somalis
English
5.2%
UNEMPLOYMENT AMONG SENIORS OVER 65 YEARS
33.5/ 100
METRIC RATING
187th/ 347
METRIC RANK
4.9%
UNEMPLOYMENT AMONG SENIORS OVER 65 YEARS
99.5/ 100
METRIC RATING
66th/ 347
METRIC RANK
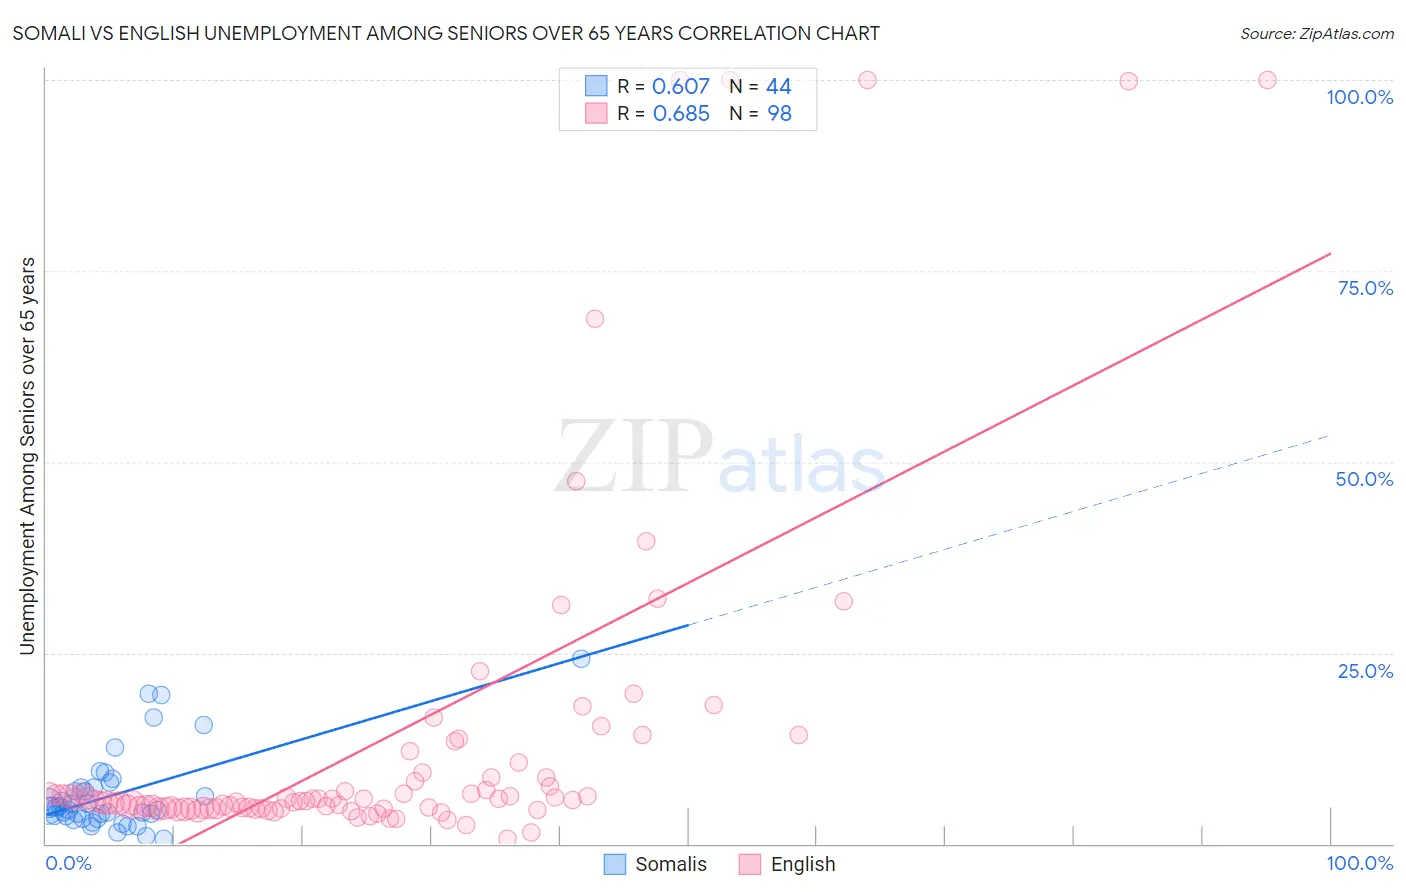
Somali vs English Unemployment Among Seniors over 65 years Correlation Chart
The statistical analysis conducted on geographies consisting of 94,958,941 people shows a significant positive correlation between the proportion of Somalis and unemployment rate amomg seniors over the age of 65 in the United States with a correlation coefficient (R) of 0.607 and weighted average of 5.2%. Similarly, the statistical analysis conducted on geographies consisting of 463,344,936 people shows a significant positive correlation between the proportion of English and unemployment rate amomg seniors over the age of 65 in the United States with a correlation coefficient (R) of 0.685 and weighted average of 4.9%, a difference of 5.1%.
Unemployment Among Seniors over 65 years Correlation Summary
| Measurement | Somali | English |
| Minimum | 0.70% | 0.63% |
| Maximum | 24.3% | 100.0% |
| Range | 23.6% | 99.4% |
| Mean | 6.4% | 13.6% |
| Median | 4.8% | 5.7% |
| Interquartile 25% (IQ1) | 3.5% | 4.6% |
| Interquartile 75% (IQ3) | 7.3% | 8.7% |
| Interquartile Range (IQR) | 3.8% | 4.1% |
| Standard Deviation (Sample) | 5.2% | 22.4% |
| Standard Deviation (Population) | 5.2% | 22.3% |
Similar Demographics by Unemployment Among Seniors over 65 years
Demographics Similar to Somalis by Unemployment Among Seniors over 65 years
In terms of unemployment among seniors over 65 years, the demographic groups most similar to Somalis are Immigrants from Egypt (5.2%, a difference of 0.010%), Bangladeshi (5.2%, a difference of 0.050%), American (5.2%, a difference of 0.060%), Korean (5.2%, a difference of 0.070%), and Immigrants from Iran (5.2%, a difference of 0.090%).
| Demographics | Rating | Rank | Unemployment Among Seniors over 65 years |
| Russians | 43.6 /100 | #180 | Average 5.2% |
| Immigrants | Italy | 43.5 /100 | #181 | Average 5.2% |
| Panamanians | 43.0 /100 | #182 | Average 5.2% |
| Immigrants | Western Asia | 42.1 /100 | #183 | Average 5.2% |
| Immigrants | Serbia | 41.6 /100 | #184 | Average 5.2% |
| Immigrants | Iran | 36.0 /100 | #185 | Fair 5.2% |
| Americans | 35.1 /100 | #186 | Fair 5.2% |
| Somalis | 33.5 /100 | #187 | Fair 5.2% |
| Immigrants | Egypt | 33.2 /100 | #188 | Fair 5.2% |
| Bangladeshis | 32.3 /100 | #189 | Fair 5.2% |
| Koreans | 31.6 /100 | #190 | Fair 5.2% |
| Immigrants | Denmark | 31.0 /100 | #191 | Fair 5.2% |
| Sioux | 30.8 /100 | #192 | Fair 5.2% |
| Immigrants | Africa | 29.6 /100 | #193 | Fair 5.2% |
| Argentineans | 29.1 /100 | #194 | Fair 5.2% |
Demographics Similar to English by Unemployment Among Seniors over 65 years
In terms of unemployment among seniors over 65 years, the demographic groups most similar to English are Iroquois (4.9%, a difference of 0.020%), Immigrants from Nicaragua (4.9%, a difference of 0.050%), Bolivian (4.9%, a difference of 0.060%), Scottish (4.9%, a difference of 0.10%), and Croatian (4.9%, a difference of 0.13%).
| Demographics | Rating | Rank | Unemployment Among Seniors over 65 years |
| Immigrants | Eastern Africa | 99.7 /100 | #59 | Exceptional 4.9% |
| Immigrants | Middle Africa | 99.7 /100 | #60 | Exceptional 4.9% |
| Northern Europeans | 99.7 /100 | #61 | Exceptional 4.9% |
| Latvians | 99.6 /100 | #62 | Exceptional 4.9% |
| Croatians | 99.6 /100 | #63 | Exceptional 4.9% |
| Immigrants | Cambodia | 99.6 /100 | #64 | Exceptional 4.9% |
| Immigrants | Nicaragua | 99.6 /100 | #65 | Exceptional 4.9% |
| English | 99.5 /100 | #66 | Exceptional 4.9% |
| Iroquois | 99.5 /100 | #67 | Exceptional 4.9% |
| Bolivians | 99.5 /100 | #68 | Exceptional 4.9% |
| Scottish | 99.5 /100 | #69 | Exceptional 4.9% |
| Immigrants | Kazakhstan | 99.4 /100 | #70 | Exceptional 4.9% |
| Immigrants | Moldova | 99.4 /100 | #71 | Exceptional 4.9% |
| Nicaraguans | 99.3 /100 | #72 | Exceptional 4.9% |
| Immigrants | Japan | 99.2 /100 | #73 | Exceptional 4.9% |