Estonian vs Egyptian Unemployment Among Women with Children Ages 6 to 17 years
COMPARE
Estonian
Egyptian
Unemployment Among Women with Children Ages 6 to 17 years
Unemployment Among Women with Children Ages 6 to 17 years Comparison
Estonians
Egyptians
9.3%
UNEMPLOYMENT AMONG WOMEN WITH CHILDREN AGES 6 TO 17 YEARS
4.4/ 100
METRIC RATING
228th/ 347
METRIC RANK
8.7%
UNEMPLOYMENT AMONG WOMEN WITH CHILDREN AGES 6 TO 17 YEARS
91.8/ 100
METRIC RATING
133rd/ 347
METRIC RANK
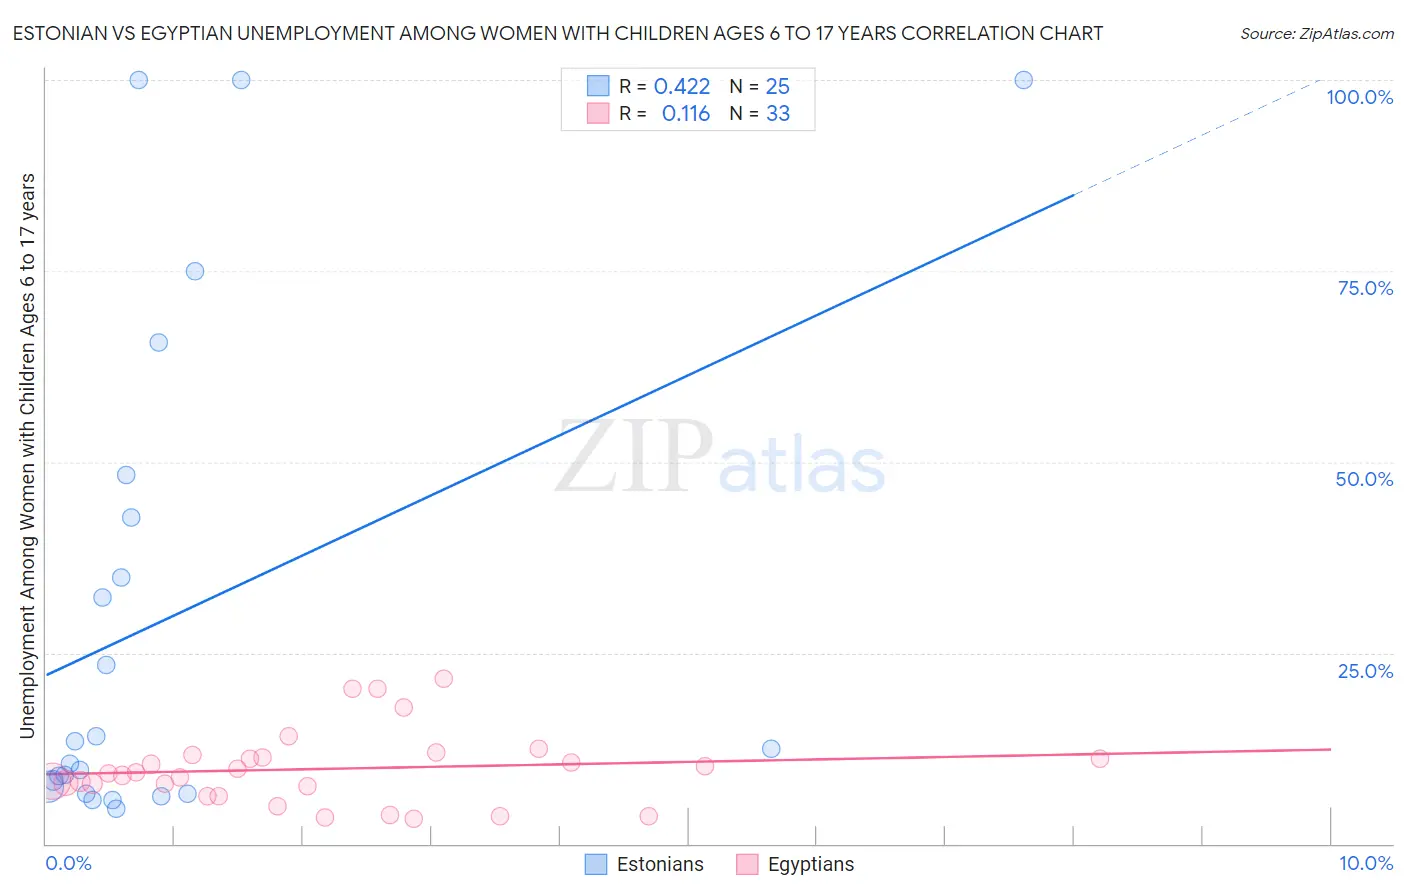
Estonian vs Egyptian Unemployment Among Women with Children Ages 6 to 17 years Correlation Chart
The statistical analysis conducted on geographies consisting of 102,254,464 people shows a moderate positive correlation between the proportion of Estonians and unemployment rate among women with children between the ages 6 and 17 in the United States with a correlation coefficient (R) of 0.422 and weighted average of 9.3%. Similarly, the statistical analysis conducted on geographies consisting of 213,857,106 people shows a poor positive correlation between the proportion of Egyptians and unemployment rate among women with children between the ages 6 and 17 in the United States with a correlation coefficient (R) of 0.116 and weighted average of 8.7%, a difference of 6.3%.
Unemployment Among Women with Children Ages 6 to 17 years Correlation Summary
| Measurement | Estonian | Egyptian |
| Minimum | 4.5% | 3.2% |
| Maximum | 100.0% | 21.6% |
| Range | 95.5% | 18.4% |
| Mean | 30.0% | 9.8% |
| Median | 12.5% | 9.2% |
| Interquartile 25% (IQ1) | 7.0% | 6.9% |
| Interquartile 75% (IQ3) | 45.5% | 11.5% |
| Interquartile Range (IQR) | 38.5% | 4.6% |
| Standard Deviation (Sample) | 32.6% | 4.8% |
| Standard Deviation (Population) | 32.0% | 4.7% |
Similar Demographics by Unemployment Among Women with Children Ages 6 to 17 years
Demographics Similar to Estonians by Unemployment Among Women with Children Ages 6 to 17 years
In terms of unemployment among women with children ages 6 to 17 years, the demographic groups most similar to Estonians are Panamanian (9.3%, a difference of 0.020%), Lumbee (9.3%, a difference of 0.030%), Immigrants from the Azores (9.3%, a difference of 0.050%), Welsh (9.3%, a difference of 0.13%), and Macedonian (9.3%, a difference of 0.14%).
| Demographics | Rating | Rank | Unemployment Among Women with Children Ages 6 to 17 years |
| Crow | 5.8 /100 | #221 | Tragic 9.2% |
| Immigrants | Southern Europe | 5.8 /100 | #222 | Tragic 9.2% |
| Immigrants | Eritrea | 5.8 /100 | #223 | Tragic 9.2% |
| Immigrants | El Salvador | 5.3 /100 | #224 | Tragic 9.3% |
| Chinese | 5.2 /100 | #225 | Tragic 9.3% |
| Immigrants | Azores | 4.6 /100 | #226 | Tragic 9.3% |
| Panamanians | 4.5 /100 | #227 | Tragic 9.3% |
| Estonians | 4.4 /100 | #228 | Tragic 9.3% |
| Lumbee | 4.3 /100 | #229 | Tragic 9.3% |
| Welsh | 4.0 /100 | #230 | Tragic 9.3% |
| Macedonians | 3.9 /100 | #231 | Tragic 9.3% |
| French American Indians | 3.7 /100 | #232 | Tragic 9.3% |
| Immigrants | St. Vincent and the Grenadines | 3.3 /100 | #233 | Tragic 9.3% |
| Mexicans | 3.2 /100 | #234 | Tragic 9.3% |
| Uruguayans | 3.0 /100 | #235 | Tragic 9.3% |
Demographics Similar to Egyptians by Unemployment Among Women with Children Ages 6 to 17 years
In terms of unemployment among women with children ages 6 to 17 years, the demographic groups most similar to Egyptians are Yaqui (8.7%, a difference of 0.060%), Slavic (8.7%, a difference of 0.070%), Immigrants from Ireland (8.7%, a difference of 0.11%), European (8.7%, a difference of 0.17%), and Immigrants from Latvia (8.7%, a difference of 0.20%).
| Demographics | Rating | Rank | Unemployment Among Women with Children Ages 6 to 17 years |
| Immigrants | Northern Africa | 94.4 /100 | #126 | Exceptional 8.7% |
| Czechs | 94.4 /100 | #127 | Exceptional 8.7% |
| Hmong | 94.3 /100 | #128 | Exceptional 8.7% |
| Barbadians | 93.8 /100 | #129 | Exceptional 8.7% |
| Immigrants | Western Asia | 93.1 /100 | #130 | Exceptional 8.7% |
| Slavs | 92.2 /100 | #131 | Exceptional 8.7% |
| Yaqui | 92.2 /100 | #132 | Exceptional 8.7% |
| Egyptians | 91.8 /100 | #133 | Exceptional 8.7% |
| Immigrants | Ireland | 91.0 /100 | #134 | Exceptional 8.7% |
| Europeans | 90.6 /100 | #135 | Exceptional 8.7% |
| Immigrants | Latvia | 90.4 /100 | #136 | Exceptional 8.7% |
| Immigrants | Argentina | 90.0 /100 | #137 | Excellent 8.7% |
| Immigrants | Ethiopia | 89.5 /100 | #138 | Excellent 8.8% |
| Northern Europeans | 89.2 /100 | #139 | Excellent 8.8% |
| Immigrants | Poland | 88.3 /100 | #140 | Excellent 8.8% |