Syrian vs Lebanese Unemployment Among Ages 35 to 44 years
COMPARE
Syrian
Lebanese
Unemployment Among Ages 35 to 44 years
Unemployment Among Ages 35 to 44 years Comparison
Syrians
Lebanese
4.6%
UNEMPLOYMENT AMONG AGES 35 TO 44 YEARS
80.7/ 100
METRIC RATING
133rd/ 347
METRIC RANK
4.7%
UNEMPLOYMENT AMONG AGES 35 TO 44 YEARS
51.4/ 100
METRIC RATING
172nd/ 347
METRIC RANK
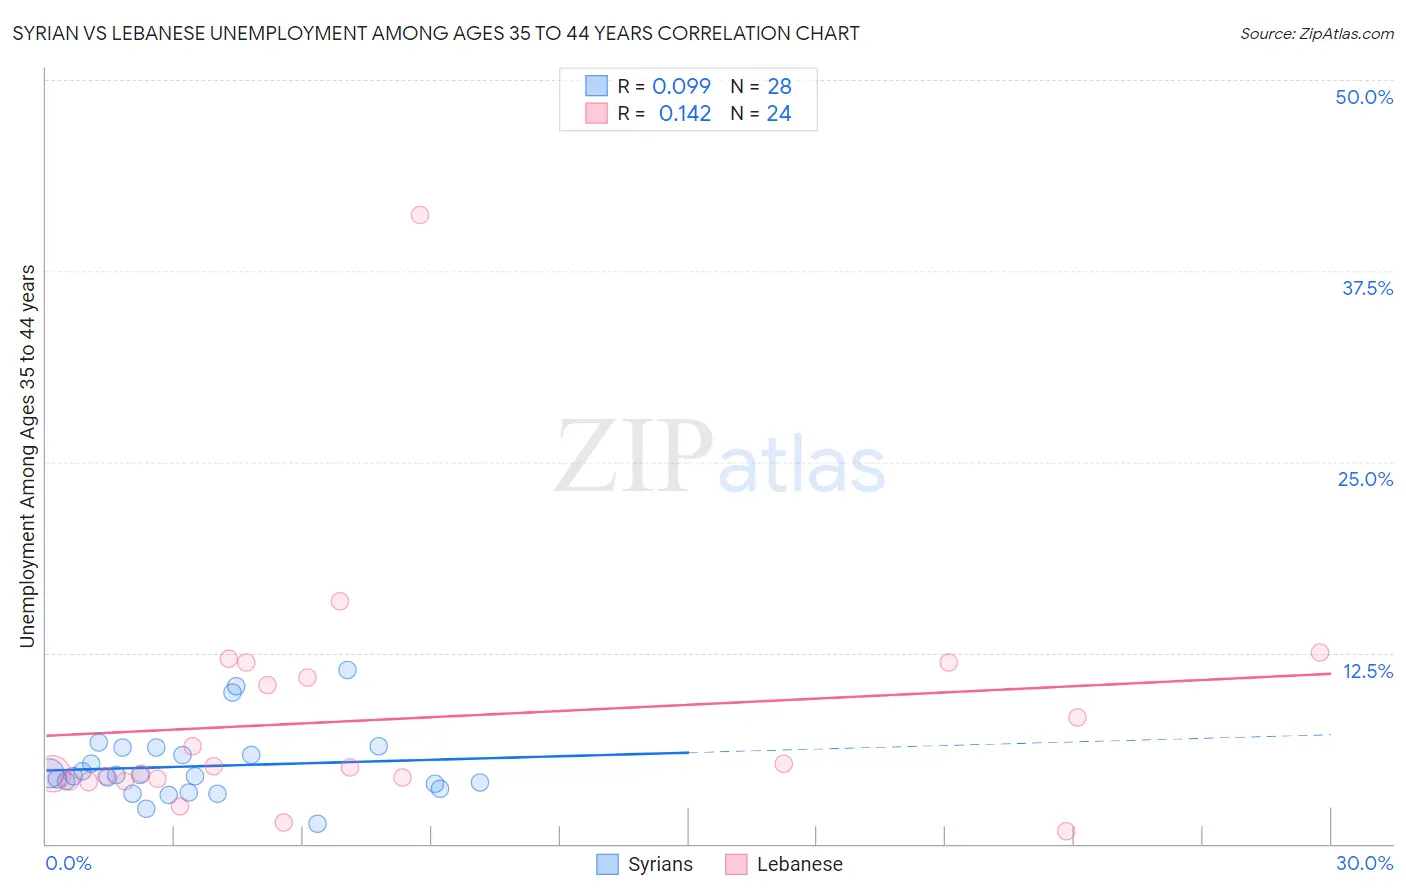
Syrian vs Lebanese Unemployment Among Ages 35 to 44 years Correlation Chart
The statistical analysis conducted on geographies consisting of 262,414,957 people shows a slight positive correlation between the proportion of Syrians and unemployment rate among population between the ages 35 and 44 in the United States with a correlation coefficient (R) of 0.099 and weighted average of 4.6%. Similarly, the statistical analysis conducted on geographies consisting of 391,592,088 people shows a poor positive correlation between the proportion of Lebanese and unemployment rate among population between the ages 35 and 44 in the United States with a correlation coefficient (R) of 0.142 and weighted average of 4.7%, a difference of 2.5%.
Unemployment Among Ages 35 to 44 years Correlation Summary
| Measurement | Syrian | Lebanese |
| Minimum | 1.3% | 0.80% |
| Maximum | 11.3% | 41.2% |
| Range | 10.0% | 40.4% |
| Mean | 5.1% | 8.2% |
| Median | 4.4% | 5.0% |
| Interquartile 25% (IQ1) | 3.7% | 4.2% |
| Interquartile 75% (IQ3) | 6.0% | 11.4% |
| Interquartile Range (IQR) | 2.3% | 7.2% |
| Standard Deviation (Sample) | 2.3% | 8.1% |
| Standard Deviation (Population) | 2.2% | 7.9% |
Similar Demographics by Unemployment Among Ages 35 to 44 years
Demographics Similar to Syrians by Unemployment Among Ages 35 to 44 years
In terms of unemployment among ages 35 to 44 years, the demographic groups most similar to Syrians are Colombian (4.6%, a difference of 0.020%), Laotian (4.6%, a difference of 0.070%), Immigrants from Europe (4.6%, a difference of 0.14%), Scotch-Irish (4.6%, a difference of 0.16%), and Immigrants from Iraq (4.6%, a difference of 0.20%).
| Demographics | Rating | Rank | Unemployment Among Ages 35 to 44 years |
| Immigrants | Austria | 84.7 /100 | #126 | Excellent 4.5% |
| Immigrants | Ethiopia | 84.7 /100 | #127 | Excellent 4.5% |
| Czechoslovakians | 83.4 /100 | #128 | Excellent 4.6% |
| Immigrants | Croatia | 83.1 /100 | #129 | Excellent 4.6% |
| Immigrants | Eritrea | 82.8 /100 | #130 | Excellent 4.6% |
| Immigrants | Colombia | 82.6 /100 | #131 | Excellent 4.6% |
| Colombians | 80.8 /100 | #132 | Excellent 4.6% |
| Syrians | 80.7 /100 | #133 | Excellent 4.6% |
| Laotians | 80.1 /100 | #134 | Excellent 4.6% |
| Immigrants | Europe | 79.4 /100 | #135 | Good 4.6% |
| Scotch-Irish | 79.3 /100 | #136 | Good 4.6% |
| Immigrants | Iraq | 78.9 /100 | #137 | Good 4.6% |
| Immigrants | Norway | 77.5 /100 | #138 | Good 4.6% |
| Immigrants | Hungary | 76.3 /100 | #139 | Good 4.6% |
| Immigrants | Eastern Africa | 76.0 /100 | #140 | Good 4.6% |
Demographics Similar to Lebanese by Unemployment Among Ages 35 to 44 years
In terms of unemployment among ages 35 to 44 years, the demographic groups most similar to Lebanese are Indonesian (4.7%, a difference of 0.020%), Iraqi (4.7%, a difference of 0.040%), Immigrants from Indonesia (4.7%, a difference of 0.090%), Afghan (4.7%, a difference of 0.10%), and Pennsylvania German (4.7%, a difference of 0.12%).
| Demographics | Rating | Rank | Unemployment Among Ages 35 to 44 years |
| German Russians | 57.2 /100 | #165 | Average 4.7% |
| French | 55.6 /100 | #166 | Average 4.7% |
| Peruvians | 54.4 /100 | #167 | Average 4.7% |
| Arabs | 53.1 /100 | #168 | Average 4.7% |
| Pennsylvania Germans | 53.0 /100 | #169 | Average 4.7% |
| Immigrants | Indonesia | 52.6 /100 | #170 | Average 4.7% |
| Indonesians | 51.7 /100 | #171 | Average 4.7% |
| Lebanese | 51.4 /100 | #172 | Average 4.7% |
| Iraqis | 50.9 /100 | #173 | Average 4.7% |
| Afghans | 50.0 /100 | #174 | Average 4.7% |
| Immigrants | Germany | 48.9 /100 | #175 | Average 4.7% |
| Immigrants | Uganda | 48.1 /100 | #176 | Average 4.7% |
| Slovaks | 44.6 /100 | #177 | Average 4.7% |
| South American Indians | 40.7 /100 | #178 | Average 4.7% |
| Immigrants | South Eastern Asia | 40.2 /100 | #179 | Average 4.7% |