Syrian vs Immigrants from South Africa Female Unemployment
COMPARE
Syrian
Immigrants from South Africa
Female Unemployment
Female Unemployment Comparison
Syrians
Immigrants from South Africa
5.2%
FEMALE UNEMPLOYMENT
62.8/ 100
METRIC RATING
165th/ 347
METRIC RANK
5.1%
FEMALE UNEMPLOYMENT
87.6/ 100
METRIC RATING
123rd/ 347
METRIC RANK
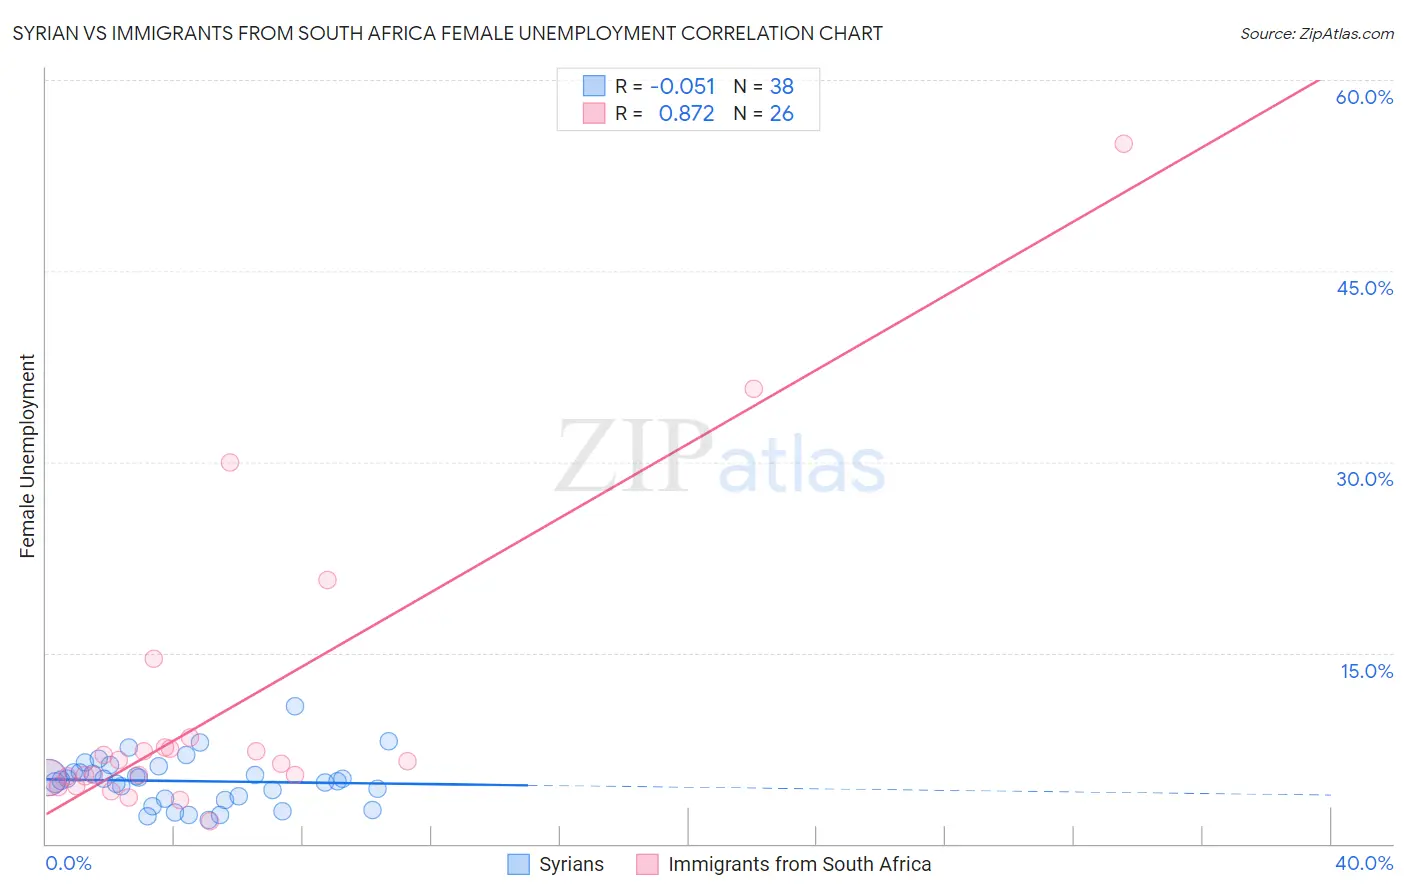
Syrian vs Immigrants from South Africa Female Unemployment Correlation Chart
The statistical analysis conducted on geographies consisting of 265,589,299 people shows a slight negative correlation between the proportion of Syrians and unemploymnet rate among females in the United States with a correlation coefficient (R) of -0.051 and weighted average of 5.2%. Similarly, the statistical analysis conducted on geographies consisting of 232,687,706 people shows a very strong positive correlation between the proportion of Immigrants from South Africa and unemploymnet rate among females in the United States with a correlation coefficient (R) of 0.872 and weighted average of 5.1%, a difference of 2.2%.
Female Unemployment Correlation Summary
| Measurement | Syrian | Immigrants from South Africa |
| Minimum | 1.9% | 1.8% |
| Maximum | 10.8% | 55.0% |
| Range | 8.9% | 53.2% |
| Mean | 4.9% | 10.5% |
| Median | 5.0% | 6.4% |
| Interquartile 25% (IQ1) | 3.5% | 5.2% |
| Interquartile 75% (IQ3) | 5.6% | 7.6% |
| Interquartile Range (IQR) | 2.1% | 2.4% |
| Standard Deviation (Sample) | 1.9% | 12.1% |
| Standard Deviation (Population) | 1.9% | 11.9% |
Similar Demographics by Female Unemployment
Demographics Similar to Syrians by Female Unemployment
In terms of female unemployment, the demographic groups most similar to Syrians are Native Hawaiian (5.2%, a difference of 0.0%), Immigrants from Thailand (5.2%, a difference of 0.040%), Immigrants from Asia (5.2%, a difference of 0.10%), Bangladeshi (5.2%, a difference of 0.10%), and Potawatomi (5.2%, a difference of 0.21%).
| Demographics | Rating | Rank | Female Unemployment |
| Albanians | 68.3 /100 | #158 | Good 5.2% |
| Immigrants | Micronesia | 66.9 /100 | #159 | Good 5.2% |
| Immigrants | Spain | 66.8 /100 | #160 | Good 5.2% |
| Immigrants | Pakistan | 66.7 /100 | #161 | Good 5.2% |
| Potawatomi | 65.9 /100 | #162 | Good 5.2% |
| Immigrants | Asia | 64.3 /100 | #163 | Good 5.2% |
| Bangladeshis | 64.3 /100 | #164 | Good 5.2% |
| Syrians | 62.8 /100 | #165 | Good 5.2% |
| Native Hawaiians | 62.7 /100 | #166 | Good 5.2% |
| Immigrants | Thailand | 62.1 /100 | #167 | Good 5.2% |
| Sri Lankans | 59.4 /100 | #168 | Average 5.2% |
| Immigrants | Chile | 59.0 /100 | #169 | Average 5.2% |
| Spanish | 55.9 /100 | #170 | Average 5.2% |
| Immigrants | Denmark | 55.0 /100 | #171 | Average 5.2% |
| Immigrants | Uganda | 50.7 /100 | #172 | Average 5.3% |
Demographics Similar to Immigrants from South Africa by Female Unemployment
In terms of female unemployment, the demographic groups most similar to Immigrants from South Africa are Immigrants from Germany (5.1%, a difference of 0.0%), Immigrants from Europe (5.1%, a difference of 0.050%), Immigrants from Romania (5.1%, a difference of 0.080%), Immigrants from Western Europe (5.1%, a difference of 0.080%), and Immigrants from North Macedonia (5.1%, a difference of 0.10%).
| Demographics | Rating | Rank | Female Unemployment |
| Americans | 90.5 /100 | #116 | Exceptional 5.1% |
| Jordanians | 90.3 /100 | #117 | Exceptional 5.1% |
| Immigrants | Croatia | 89.9 /100 | #118 | Excellent 5.1% |
| Immigrants | North Macedonia | 88.3 /100 | #119 | Excellent 5.1% |
| Immigrants | Romania | 88.1 /100 | #120 | Excellent 5.1% |
| Immigrants | Western Europe | 88.1 /100 | #121 | Excellent 5.1% |
| Immigrants | Germany | 87.6 /100 | #122 | Excellent 5.1% |
| Immigrants | South Africa | 87.6 /100 | #123 | Excellent 5.1% |
| Immigrants | Europe | 87.2 /100 | #124 | Excellent 5.1% |
| Basques | 86.5 /100 | #125 | Excellent 5.1% |
| Immigrants | Korea | 86.3 /100 | #126 | Excellent 5.1% |
| Immigrants | Hungary | 86.0 /100 | #127 | Excellent 5.1% |
| Chileans | 85.8 /100 | #128 | Excellent 5.1% |
| Ethiopians | 85.7 /100 | #129 | Excellent 5.1% |
| Maltese | 85.5 /100 | #130 | Excellent 5.1% |