Immigrants from Switzerland vs Immigrants from South Africa Female Unemployment
COMPARE
Immigrants from Switzerland
Immigrants from South Africa
Female Unemployment
Female Unemployment Comparison
Immigrants from Switzerland
Immigrants from South Africa
5.1%
FEMALE UNEMPLOYMENT
93.1/ 100
METRIC RATING
107th/ 347
METRIC RANK
5.1%
FEMALE UNEMPLOYMENT
87.6/ 100
METRIC RATING
123rd/ 347
METRIC RANK
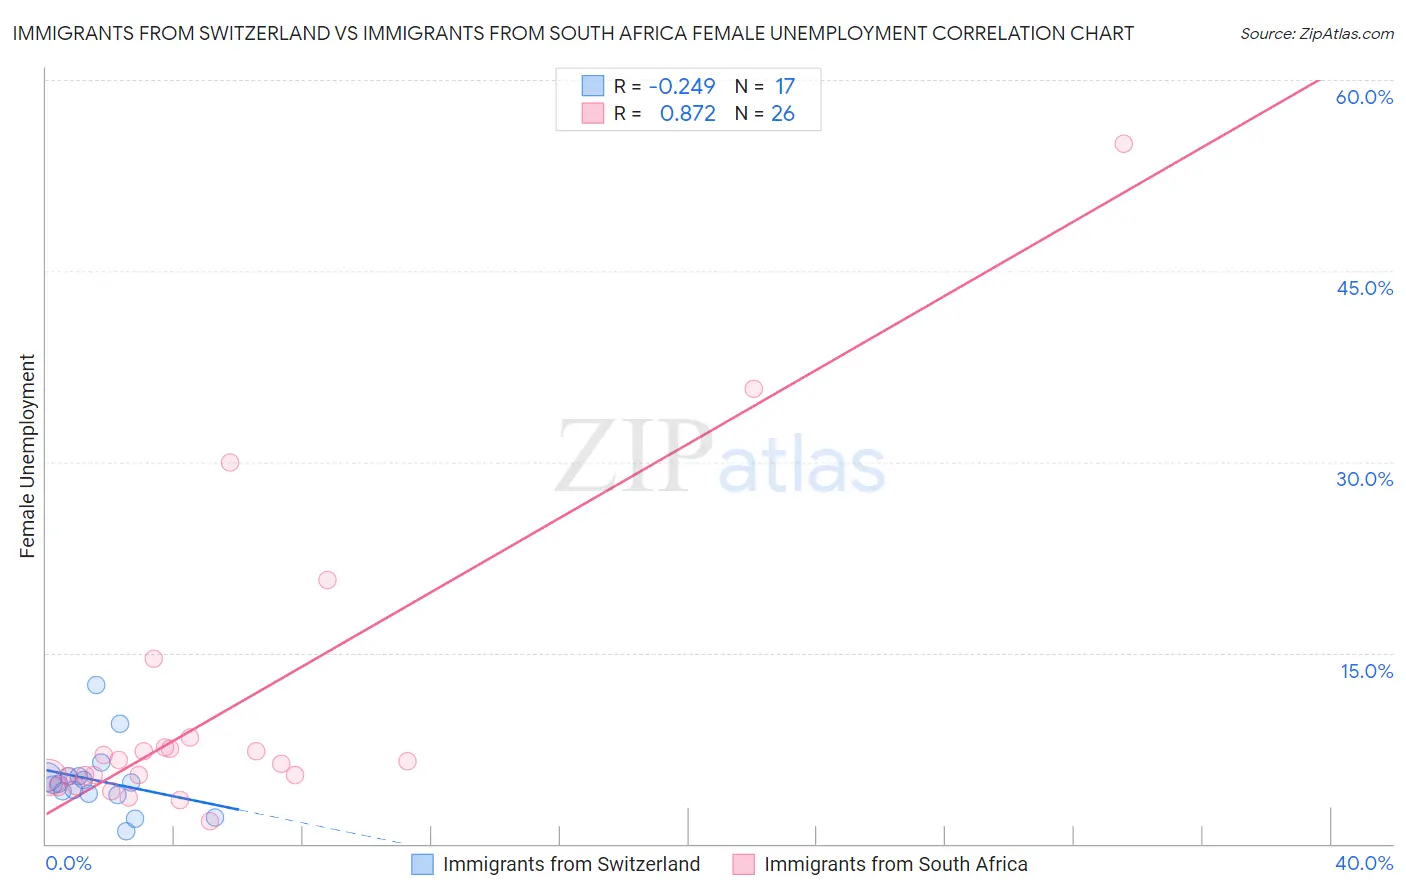
Immigrants from Switzerland vs Immigrants from South Africa Female Unemployment Correlation Chart
The statistical analysis conducted on geographies consisting of 147,831,488 people shows a weak negative correlation between the proportion of Immigrants from Switzerland and unemploymnet rate among females in the United States with a correlation coefficient (R) of -0.249 and weighted average of 5.1%. Similarly, the statistical analysis conducted on geographies consisting of 232,687,706 people shows a very strong positive correlation between the proportion of Immigrants from South Africa and unemploymnet rate among females in the United States with a correlation coefficient (R) of 0.872 and weighted average of 5.1%, a difference of 1.0%.
Female Unemployment Correlation Summary
| Measurement | Immigrants from Switzerland | Immigrants from South Africa |
| Minimum | 1.0% | 1.8% |
| Maximum | 12.5% | 55.0% |
| Range | 11.5% | 53.2% |
| Mean | 5.0% | 10.5% |
| Median | 4.7% | 6.4% |
| Interquartile 25% (IQ1) | 3.8% | 5.2% |
| Interquartile 75% (IQ3) | 5.3% | 7.6% |
| Interquartile Range (IQR) | 1.4% | 2.4% |
| Standard Deviation (Sample) | 2.7% | 12.1% |
| Standard Deviation (Population) | 2.6% | 11.9% |
Demographics Similar to Immigrants from Switzerland and Immigrants from South Africa by Female Unemployment
In terms of female unemployment, the demographic groups most similar to Immigrants from Switzerland are Puget Sound Salish (5.1%, a difference of 0.020%), Paraguayan (5.1%, a difference of 0.030%), Immigrants from Eastern Africa (5.1%, a difference of 0.060%), Immigrants from England (5.0%, a difference of 0.12%), and Macedonian (5.1%, a difference of 0.17%). Similarly, the demographic groups most similar to Immigrants from South Africa are Immigrants from Germany (5.1%, a difference of 0.0%), Immigrants from Europe (5.1%, a difference of 0.050%), Immigrants from Romania (5.1%, a difference of 0.080%), Immigrants from Western Europe (5.1%, a difference of 0.080%), and Immigrants from North Macedonia (5.1%, a difference of 0.10%).
| Demographics | Rating | Rank | Female Unemployment |
| Immigrants | England | 93.6 /100 | #105 | Exceptional 5.0% |
| Paraguayans | 93.2 /100 | #106 | Exceptional 5.1% |
| Immigrants | Switzerland | 93.1 /100 | #107 | Exceptional 5.1% |
| Puget Sound Salish | 93.0 /100 | #108 | Exceptional 5.1% |
| Immigrants | Eastern Africa | 92.8 /100 | #109 | Exceptional 5.1% |
| Macedonians | 92.4 /100 | #110 | Exceptional 5.1% |
| Immigrants | Burma/Myanmar | 92.3 /100 | #111 | Exceptional 5.1% |
| Estonians | 92.1 /100 | #112 | Exceptional 5.1% |
| Immigrants | Saudi Arabia | 91.2 /100 | #113 | Exceptional 5.1% |
| Immigrants | Turkey | 91.0 /100 | #114 | Exceptional 5.1% |
| Lebanese | 91.0 /100 | #115 | Exceptional 5.1% |
| Americans | 90.5 /100 | #116 | Exceptional 5.1% |
| Jordanians | 90.3 /100 | #117 | Exceptional 5.1% |
| Immigrants | Croatia | 89.9 /100 | #118 | Excellent 5.1% |
| Immigrants | North Macedonia | 88.3 /100 | #119 | Excellent 5.1% |
| Immigrants | Romania | 88.1 /100 | #120 | Excellent 5.1% |
| Immigrants | Western Europe | 88.1 /100 | #121 | Excellent 5.1% |
| Immigrants | Germany | 87.6 /100 | #122 | Excellent 5.1% |
| Immigrants | South Africa | 87.6 /100 | #123 | Excellent 5.1% |
| Immigrants | Europe | 87.2 /100 | #124 | Excellent 5.1% |
| Basques | 86.5 /100 | #125 | Excellent 5.1% |